ATLAS-CONF-2018-046 20September2018
ATLAS CONF Note
ATLAS-CONF-2018-046
20th September 2018
Study of the rare decays of B 0 s and B 0 into muon pairs from data collected during 2015 and 2016
with the ATLAS detector
The ATLAS Collaboration
A study of the decays
Bs0 → µ+µ−and
B0 → µ+µ−has been performed using 26
.3 fb
−1of 13 TeV LHC proton–proton collisions collected with the ATLAS detector in 2015 and 2016. For
B0s, the branching fraction
B(Bs0 → µ+µ−) =3
.2
+1−1..10×
10
−9is measured. For the
B0, an upper limit on the branching fraction is set at
B(B0 → µ+µ−) <4
.3
×10
−10at 95% confidence level. The result is combined with the full Run 1 ATLAS result, yielding
B(B0s → µ+µ−) =2
.8
+0−0..87×
10
−9and
B(B0→ µ+µ−) <2
.1
×10
−10. The combined result is consistent with the Standard Model within 2.4 standard deviations.
© 2018 CERN for the benefit of the ATLAS Collaboration.
1 Introduction
Flavour-changing neutral-current (FCNC) processes are highly suppressed in the Standard Model (SM), and their study is relevant to indirect searches for physics beyond the SM. The branching fractions of the decays
B0(s) → µ+µ−are of particular interest because of the additional helicity suppression and since they are accurately predicted in the SM:
B(B0s → µ+µ−) = (3
.65
±0
.23
)×10
−9and
B(B0 → µ+µ−) = (1
.06
±0
.09
) ×10
−10[1]. Deviations at the level of these values - or even larger - can arise in models involving non-SM heavy particles, such as those predicted in the Minimal Supersymmetric Standard Model [2–6], in extensions such as Minimal Flavour Violation [7, 8], Two-Higgs-Doublet Models [6], and others [9, 10]. The CMS and LHCb collaborations have reported the observation of
Bs0→ µ+µ−[11, 12] and evidence for
B0 → µ+µ−, with combined values:
B(Bs0 → µ+µ−) =2
.8
+0−0..76×
10
−9and
B(B0 → µ+µ−) =3
.9
+1.6−1.4×
10
−10[13]. The LHCb collaboration updated its Run 1 result with part of the data collected in Run 2, measuring
B(B0s → µ+µ−) =3
.0
±0
.6
+0−0..32×
10
−9(where the first uncertainty is statistical and the second systematic) and
B(B0 → µ+µ−) <3
.4
×10
−10at 95% CL [14].
ATLAS has measured, with the Run 1 dataset [15],
B(B0s → µ+µ−) =0
.9
+1−0..18×
10
−9, while setting an upper bound on
B0→ µ+µ−of 4
.2
×10
−10at 95% CL.
This paper reports the result of a search for
B0s → µ+µ−and
B0 → µ+µ−decays performed using
ppcollision data corresponding to an integrated luminosity of 36.2 fb
−1, collected at 13 TeV during the first two years of the LHC Run 2 data-taking period using the ATLAS detector. The analysis strategy follows the approach employed in the previous ATLAS measurement [15], using data collected with one rather than three separate sets of trigger thresholds, standard ATLAS muon selection criteria (Section 4) and an improved statistical treatment of the result (Section 11).
2 Outline
The notation used throughout the paper refers to the combination of processes and their charge-conjugates, unless otherwise specified. The
Bs0→µ+µ−and
B0 →µ+µ−branching fractions are measured relative to the normalisation decay
B+ → J/ψ(→ µ+µ−)K+which is abundant and has a well measured branching fraction
B(B+→ J/ψK+)× B(J/ψ → µ+µ−). The
B0 → µ+µ−(
Bs0 → µ+µ−) branching fraction can be extracted as:
B(B0(s)→µ+µ−) = Nd(s) εµ+µ− ×
B(B+→ J/ψK+)× B(J/ψ→ µ+µ−) εJ/ψK+
NJ/ψK+ × fu fd(s)
= Nd(s)B(B+→ J/ψK+)× B(J/ψ→ µ+µ−) Dnorm × fu
fd(s),
(1) where
Nd(
Ns) is the
B0→ µ+µ−(
B0s →µ+µ−) signal yield,
NJ/ψK+is the
B+→J/ψK+normalisation yield,
εµ+µ−and
εJ/ψK+are the corresponding values of acceptance times efficiency (measured in fiducial volumes defined in Section 10), and
fu/fd(
fu/fs) is the ratio of the hadronisation probabilities of a
b-quark into
B+and
B0(
B0s). The quantity
Dnorm = NJ/ψK+ε
µ+µ− εJ/ψK+
, where the
εratio takes into
account relative differences in efficiencies, integrated luminosities and the trigger selections used for the
signal and the normalisation modes. Signal and reference channel events are selected with similar dimuon
triggers. When determining the control channel normalisation, the half of the statistics used to tune the
kinematic distributions of simulated events is excluded.
The event selection uses variables related to the candidates decay time, thus introducing a dependence of the efficiency on the signal lifetime. The relation between the measured branching fraction and the corresponding value at production is established assuming the decay time distribution predicted in the SM, where the decay occurs predominantly through the heavy eigenstate
Bs/d,Hof the
B0(s)-
B0(s)system.
Models for new physics [16, 17] can predict modification to the decay time distribution of
B0s → µ+µ−and a comparison with the experimental result may require a correction to the ratio of the time-integrated efficiencies.
The ATLAS inner tracking system, muon spectrometer and, for precise identification of muons, also calorimeters, are used to reconstruct and select the event candidates. Details of the detector, trigger, data sets, and preliminary selection criteria are discussed in Sections 3 and 4. A blind analysis was performed in which data in the dimuon invariant mass region from 5166 to 5526 MeV were removed until the procedures for event selection and the details of signal yield extraction were completely defined. Section 5 introduces the three main categories of background. Section 6 describes the strategy used to reduce the probability of hadron misidentification. The final sample of candidates is selected using a multivariate classifier, designed to enhance the signal relative to the dominant di-muon background component, as discussed in Section 7. Checks on the distributions of the variables used in the multivariate classifier are summarised in Section 8. They are based on the comparison of data and simulation for dimuon events, for
B+ → J/ψK+candidates and for events selected as
B0s → J/ψ φ → µ+µ−K+K−, which provide an additional validation of the procedures used in the analysis. Section 9 details the fit procedure to extract the yield of
B+→ J/ψK+events. The ratio of efficiencies in the signal and the normalisation channels is presented in Section 10. Section 11 describes the extraction of the signal yield, obtained with an unbinned maximum-likelihood fit performed on the dimuon invariant mass distribution. In this fit events are separated in classifier intervals to maximise the fit sensitivity. The results for the branching fractions
B(
B0s → µ+µ−) and
B(
B0 → µ+µ−) are reported in Section 12, with the likelihood combination of the present and full Run 1 results reported in Section 13.
3 ATLAS detector, data and simulation samples
The ATLAS detector1 consists of three main components: an inner detector (ID) tracking system immersed in a 2 T axial magnetic field, surrounded by electromagnetic and hadronic calorimeters and by the muon spectrometer (MS). A full description can be found in Ref. [18], complemented by Refs. [19, 20] for details on the Run 2 upgraded innermost silicon pixel layer.
This analysis is based on the Run 2 data recorded in 2015 and 2016 from
ppcollisions at the LHC at
√s =
13 TeV. Data used in the analysis were recorded during stable LHC beam periods. Data quality requirements were imposed, notably on the performance of the MS and ID systems. The total integrated luminosity used in this analysis is 36
.2 fb
−1. The uncertainty on this integrated luminosity is 2.1%.
It is derived, following a methodology similar to that detailed in Ref. [21], and using the LUCID-2 detector for the baseline luminosity measurements [22], from calibration of the luminosity scale using x-y beam-separation scans.
1ATLAS uses a right-handed coordinate system with its origin at the nominal interaction point. Thez-axis is along the beam pipe, thex-axis points to the centre of the LHC ring and they-axis points upward. Cylindrical coordinates(r, φ)are used in the transverse plane,r being the distance from the origin andφbeing the azimuthal angle around the beam pipe. The pseudorapidityηis defined asη=−ln[tan(θ/2)] whereθis the polar angle.
Samples of simulated Monte-Carlo (MC) events are used for training and validation of the multivariate analyses, for the determination of the efficiency ratios, and for guiding the signal extraction fits. Exclusive MC samples were produced for the signal channels
B0s → µ+µ−and
B0 → µ+µ−, the normalisation channel
B+ → J/ψK+(
J/ψ → µ+µ−), and the control channel
B0s → J/ψ φ(
φ → K+K−). In addition, background studies employ MC samples of inclusive semileptonic decays
B→ µX, samples of
B0s → K−µ+ν,
B0 →π−µ+ν,
Λb → pµ−ν,
B0(s) → hh0decays with
h(0)being a charged pion or kaon, inclusive decays
B→J/ψXas well as the exclusive
B+→J/ψ π+decay.
Most of the dimuon candidates in the data sample originate from the decays of hadrons produced in the hadronisation of
bb¯ pairs. To describe this background, a
bb¯ MC sample equivalent to roughly two to three times the luminosity integrated in data was generated requiring the presence of two muons in the final state, originating with any topology from the
bb¯ pair.
The MC samples were generated with Pythia 8 [23]. The ATLAS detector and its response are simulated using Geant4 [24, 25]. Additional
ppinteractions in the same and nearby bunch crossings (pile- up) are included in the simulation. Muon reconstruction and triggering efficiencies are corrected in the simulated samples using data-driven scale factors. The scale factors for the trigger efficiencies are obtained comparing the efficiencies between data and simulation, using a
J/ψtag-and-probe method to determine them. This procedure yields the scale factors as a function of the muon transverse momentum and pseudorapidity which are applied throughout the analysis [26]. Reconstruction and selection efficiencies are obtained from simulation and similarly corrected according to data-driven comparisons. In addition to these efficiency corrections, simulated events are reweighted to reproduce the pile-up multiplicity observed in data, and according to the equivalent integrated luminosity associated with each trigger selection.
Using the iterative reweighting method described in Ref. [27], the simulated samples of the exclusive decays considered are adjusted with two-dimensional data-driven weights (DDW) to correct for the differences between simulation and data observed in the
Bmeson transverse momentum and pseudorapidity distributions. DDW obtained from
B+ → J/ψK+decays are used to correct the simulation samples in the signal and normalisation channels. DDW obtained from the
B0s → J/ψ φcontrol channel are found to agree with those from
B+→ J/ψK+, showing the consistency of the corrections.
Residual differences between data and simulation studied on the
B+and
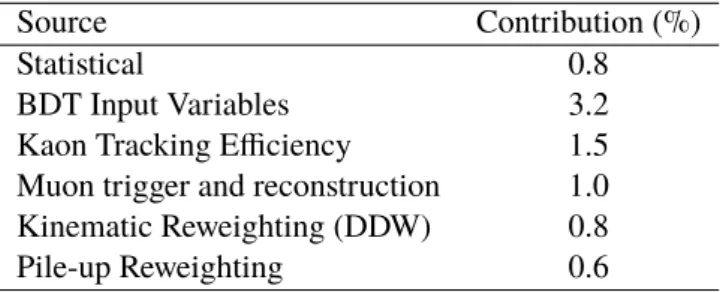
B0sreference channels are treated as sources of systematic uncertainties in the evaluation of the signal efficiency, as discussed in Section 10.
The one exception to this treatment is the
Bmeson isolation (
I0.7in Section 7 Table 1), where residual differences are used to reweight the signal MC and the corresponding uncertainties propagated to account for residual systematic effects.
Similarly to the exclusive decays, the large continuum background MC sample kinematic distributions are reweighted via corrections obtained from its comparison with the data in the sidebands of the signal region.
4 Data selection
For data collected during the LHC Run 2, the ATLAS detector uses a two-level trigger system, consisting of a hardware-based Level-1 trigger and a software-based High Level trigger. A dimuon trigger [28]
selects events at Level-1 requiring that one muon has
pT >4 GeV and the other has
pT >6 GeV. A
full track reconstruction of the muon candidates was performed at the software trigger level, where an
additional loose selection was applied to the dimuon invariant mass
mµ µ, accepting candidates in the
range 4 GeV to 8.5 GeV. Due to the increased pile-up in 2016 data, an additional selection was added at this trigger stage, requiring a positive transverse displacement projection along the dimuon momentum of the dimuon vertex with respect to the primary vertex (
Lx y). The effect of this selection is accounted for in the analysis but has no real consequences since stricter requirements are applied to the signal discriminant (see Section 7).
Both the signal and reference channels
B+ → J/ψK+and
B0s → J/ψφevents have been selected with prescales which vary during the data taking period. In the 36.2 fb
−1of data analysed, the effective integrated luminosity for the signal sample is 26.3 fb
−1, corresponding to an effective prescale of 1.4, while for the reference channels 15.1 fb
−1are collected due to an effective prescale of 2.4. These effects are taken into account in the extraction of the signal branching fraction, through the
εparameters in Eq. (1).
After offline reconstruction, a preliminary selection is performed on candidates for
B0(s) → µ+µ−,
B+ → J/ψK+ → µ+µ−K+and
Bs0 → J/ψφ → µ+µ−K+K−. In the ID system, muons are required to have at least one hit in the pixel detector and two measured intercepts in the semiconductor tracker.
They are also selected to be reconstructed in the MS, and to have
|η| <2
.5. The offline muon pair must pass the
pT >4 GeV and
pT >6 GeV thresholds imposed also by the trigger. Furthermore the muons are required to fulfil tight muon quality criteria [29], relaxed to loose for the hadron misidentification studies in Section 6. Kaon candidates have to satisfy similar requirements in the ID, except for a looser requirement of
pT >1 GeV.
B
meson properties are computed based on a decay vertex fitted to two, three or four tracks, depending on the decay process to be reconstructed.
Bcandidates are excluded when producing a
χ2per degree of freedom of the vertex fit above 6 for the
Bvertex, and above 10 for the
J/ψ → µµvertex. The selections 2915
< m(µµ) <3275 MeV and 1005
< m(K K) <1035 MeV are applied to the
J/ψ → µµand the
φ → K Kvertices, respectively. In the
B+ → J/ψK+and
Bs0 → J/ψ φfits the reconstructed dimuon mass is constrained to the
J/ψworld average value [30].
Reconstructed
Bcandidates are retained if they satisfy
pBT >
8
.0 GeV and
|ηB| <2
.5. The invariant mass for all candidates is calculated using the muons combined ID and MS information, in order to improve the mass resolution with respect to using ID information only [31].
The invariant mass range considered for the
B0(s) → µ+µ−decay starts at 4766 MeV and is 1200 MeV wide. Within this range a 360 MeV wide signal region is defined, starting at 5166 MeV. The remainder of the range defines the upper and lower mass sidebands of the analysis.
For the reference channels, the mass range considered is 4930–5630 (5050–5650) MeV for
B+→J/ψK+(
B0s → J/ψ φ) in which the 5180–5380 (5297–5437) MeV range is the peak region and the two low and high mass ranges are the mass sidebands used for background subtraction.
The coordinates of primary vertices (PV) are obtained from charged-particle tracks not used in the decay vertices, and are transversely constrained to the luminous region of the colliding beams. The matching of a
Bcandidate to a PV is made by propagating the candidate trajectory to the point of closest approach to the beam axis, and choosing the PV with the smallest separation along
z. Simulation shows that this method achieves a correct matching probability of better than 99%, for all relevant pile-up conditions.
To reduce the large background in the
B0(s) →µ+µ−channel before the final selection based on multivariate classifiers, a loose collinearity requirement is applied between the momentum of the
Bcandidate (~
pB) and the spatial separation between the PV and the decay vertex (
−→∆x
). The absolute value of the difference in
azimuthal angle
α2Dbetween these two vectors is required to be smaller than 1.0 rad. Using the difference in rapidity
∆ηfor the same vectors, an upper cut of 1
.5 is applied to the combination
∆R=pα2D2+∆η2
. After the preliminary selection, approximately 3
.5
×10
6candidates are found in the
B0(s) → µ+µ−fit region, with about 1
.0
×10
6falling in the blinded range [5166, 5526] MeV.
5 Background composition
The background to the
B0(s) →µ+µ−signal originates from three main sources:
Continuum background, the dominant combinatorial component, consisting of muons originating from uncorrelated hadron decays and characterised by a small dependence on the dimuon invariant mass;
Partially reconstructed decays, characterised by non-reconstructed final-state particles (
X) and thus accumulating in the low dimuon invariant mass sideband;
Peaking background, due to
B0(s)→h h0decays, with both hadrons misidentified as muons.
The continuum background consists mainly of muons independently produced in the fragmentation and decay chains of a
band a
bquark ( opposite-side muons). It is studied in the signal mass sidebands, and it is found to be well described by the inclusive MC sample of semileptonic decays of
band
chadrons.
The partially reconstructed decays consist of several topologies: (a) same-side combinatorial background from decay cascades (
b→ cµν → s(d)µµνν); (b) same-vertex background from
Bdecays containing a muon pair (e.g.
B0 →K∗0µµor
B → J/ψ µX → µµµX); (c)
Bcdecays (e.g.
Bc → J/ψ µν→ µµµν);
(d) semileptonic
b-hadron decays where a final-state hadron is misidentified as a muon. The remainder of this paper will implicitly exclude categories (c) and (d) when referring to partially reconstructed or
b→µµXdecays, since these categories are treated separately.
An inclusive MC sample of
bb¯
→ µµXdecays was generated and the background composition after the analysis selection was investigated. All backgrounds in this sample have a dimuon invariant mass distribution accumulating below the mass range considered in this analysis, with a high-mass tail extending beyond the signal region. The simulation does not contemplate sources other than muons from
bb¯ decays:
cc
¯ and prompt contributions are not included. All possible origins of two muons in the
bb¯ decay tree are however analysed, after classification in the mutually exclusive continuum and partially reconstructed categories described above. These samples are used exclusively to identify suitable functional models for the corresponding background components, and as benchmark for these models. No shape or normalization constraints are derived from this simulation. This makes the analysis largely insensitive to mismatches between background simulation and data.
The semileptonic decays with final-state hadrons misidentified as muons consist mainly of three-body charmless decays
B0 → πµν,
B0s → Kµνand
Λb → pµνin which the tail of the invariant mass distribution extends to the signal region. Due to branching fractions of the order of 10
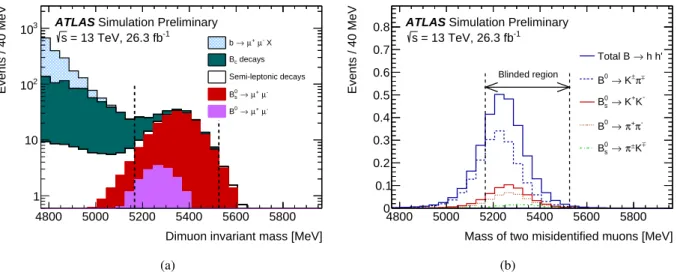
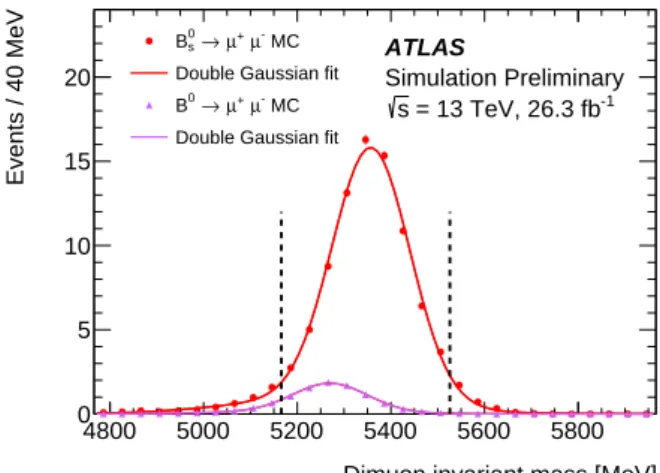
−6, this background is not large, and is further reduced by the muon identification requirements, discussed in Section 6. The MC invariant mass distributions of these partially reconstructed decay topologies are shown, together with the signals SM predictions, in Figure 1(a) after applying the preliminary selection criteria described in Section 4.
Finally, the peaking background is due to
B0(s)decays containing two hadrons misidentified as muons, which populate the signal region as shown in the distributions obtained from simulation of Figure 1(b).
Section 6 will discuss this component.
4800 5000 5200 5400 5600 5800 Dimuon invariant mass [MeV]
1 10 102
103
Events / 40 MeV
ATLAS Simulation Preliminary = 13 TeV, 26.3 fb-1
s b →µ+µ- X
decays Bc
Semi-leptonic decays µ-
µ+ s→ B0
µ-
µ+
→ B0
(a)
4800 5000 5200 5400 5600 5800
Mass of two misidentified muons [MeV]
0 0.1 0.2 0.3 0.4 0.5 0.6 0.7 0.8
Events / 40 MeV
h h'
→ Total B
π±
K±
→ B0
K-
K+ s→ B0
π-
π+
→ B0
±
±K
π
s→ B0
ATLAS Simulation Preliminary = 13 TeV, 26.3 fb-1
s
Blinded region
(b)
Figure 1: (a) Dimuon invariant mass distribution for the partially reconstructed background, from simulation, before the final selection against continuum is applied but after all other requirements. The different components are shown as stacked histograms, normalised according to world-averaged measured branching fractions. The SM expectations for theB0(s) → µ+µ−signals are also shown for comparison. Continuum background is not included here. (b) Invariant mass distribution of theB0(s)→hh0peaking background components, after the complete signal selection is applied. TheB0s →π±π∓andB0→K±K∓contributions are negligible on this scale. In both plots the vertical dashed lines indicate the analysis blinded region. Distributions are normalised to the expected yield for the integrated luminosity of 26.3 fb−1.
6 Hadron misidentification
In the preliminary selection, muon candidates are formed from the combination of tracks reconstructed independently in the ID and MS. The performance of the muon reconstruction in ATLAS is presented in Ref. [29]. Additional studies were performed to evaluate the amount of background related to hadrons erroneously identified as muons.
Detailed simulation studies were performed for the
B0(s) → hh0channel with a full Geant4-based simulation [24] in all systems of the ATLAS detector. The vast majority of background events from particle misidentification are due to decays in flight of kaons and pions, in which the muon receives most of the energy of the meson. Hence this background is generally related to true muons measured in the MS, but not produced promptly in the decay of a
Bmeson.
The muon candidate is required to pass tight muon requirements in the preliminary selection, which are based on the profile of energy deposits in the calorimeters as well as on tighter ID-MS matching criteria than the loose requirements. For two-body
Bdecays the muon efficiency of this selection is 90%, with an average reduction of the hadron misidentification by a factor 0.39, verified on control data samples. The resulting final value of the misidentification probability is equal to 0.08% for kaons and 0.1% for pions.
Efficiencies and fake rates are relative to the analysis preselections, including tracking but excluding any muon requirement.
The background due to
B0(s) → hh0, with double misidentification
hh0 → µµ, has a distribution in the
reconstructed invariant mass peaking at 5240 MeV, close to the
B0mass and is effectively indistinguishable
from the
B0signal (see Figure 1(b)). Beyond the muon selection, these events have the same acceptance and selection efficiency as the
B0(s) → µ+µ−signal. Therefore, the expected number of peaking-background events can be estimated from the number of observed
B+→ J/ψK+events, in a way analogous to that for the signal, using Eq. (1). World average [30] values for the branching fractions of
B0and
B0sinto
Kπ,
K Kand
ππare used, together with the hadron misidentification probabilities obtained from simulation. This results in 2
.7
±1
.3 total expected peaking-background events, after the reference multivariate selection2.
Inverting the tight muon selection, the number of events containing real muons is largely reduced, while the number of peaking-background events is approximately two times larger than in the sample obtained with the nominal selection. A fit to this background-enhanced sample returns 6
.8
±3
.7 events, which translates into a peaking background yield in the signal region of 2
.9
±2
.0 events, in good agreement with the simulation.
Besides the peaking background, the tight muon selection also reduces the semileptonic contributions with a single misidentified hadron. Simulation yields 30
±3 events expected from
B0→πµνand
Bs0→Kµνin the final sample, with a distribution kinematically constrained to be mostly below the signal region.
The
Λb →pµνcontribution is negligible due to the smaller production cross section and the low rate at which protons fake muons.
7 Continuum background reduction
A multivariate analysis, implemented as a boosted decision tree, is employed to enhance the signal relative to the continuum background. This classifier, referred to as the BDT , is based on the 15 variables described in Table 1. The discriminating variables can be classified into three groups: (a)
Bmeson variables, related to the reconstruction of the decay vertex and to the collinearity between
→−pBand the separation between the production and decay vertices
−→∆x
; (b) variables describing the muons forming the
Bmeson candidate;
and (c) variables related to the rest of the event. The selection of the variables aims to optimise the discrimination power of the classifier, while minimising the dependence on the invariant mass of the muon pair.
The same discriminating variables were used in the previous analysis based on the full Run 1 dataset [15].
A significant reduction of the BDT separation power has been observed when excluding discriminating variables. To minimise the dependence of the classifier on the effects of pile-up, requirements of compat- ibility with the same vertex matched to the dimuon candidate are placed on the additional tracks considered for the variables
I0.7, DOCA
xtrkand
Nclosextrk
.
The correlation between the discriminating variables was studied in the MC samples for signal and continuum background discussed in Section 3, and on data from the sidebands of the
µ+µ−invariant mass distribution. There are significant linear correlations among the variables
χ2PV,DVx y
,
Lx y,
|d0|max-sig.,
|d0|min
-sig. and
χ2µ,xPV
. The variables IP
3DB, DOCA
µ µand
I0.7have negligible correlation with any of the others used in the classifier.
The simulated signal sample and the data from the dimuon invariant mass sideband regions are used for training and testing the classifier. As discussed in Section 3, simulated signal samples are corrected for muon reconstruction efficiency discrepancies between simulation and data, and reweighted according to
2This selection, corresponding to 54% signal efficiency, has been also applied to derive all other quantities quoted in this section and includes a multivariate cut againstµ+µ−continuum background, the BDT discussed in Section7.
Table 1: Description of the 15 variables used in the discrimination between signal and continuum background.
When the BDT classifier is applied to B+ → J/ψK+ and B0s → J/ψ φcandidates, the variables related to the decay products of theBmesons refer only to the muons from the decay of theJ/ψ. Horizontal lines identify the classification in groups (a), (b) and (c) respectively, as described in the text. For category (c), additional tracks are required to havepT>500 MeVunless otherwise specified.
Variable Description pB
T Magnitude of theBcandidate transverse momentum−→ pTB. χ2PV,DVx y Compatibility of the separation
−→∆xbetween production (i.e. associated PV) and decay (DV) vertices in the transverse projection:
−→∆xT·Σ−−→−1
∆xT
·−→
∆xT, whereΣ−−→
∆xT is the covariance matrix.
∆R three-dimensional opening between→− pBand
−→∆x:pα2D2+∆η2
|α2D| Absolute value of the angle between−→ pTBand
−→∆xT(transverse projection).
Lx y Projection of
−→∆xTalong the direction of→− pTB: (−→
∆xT·−→ pTB)/|−→
pTB|.
IP3DB three-dimensional impact parameter of theBcandidate to the associated PV.
DOCAµ µ Distance of closest approach (DOCA) of the two tracks forming the B candidate (three-di- mensional).
∆φµ µ Difference in azimuthal angle between the momenta of the two tracks forming theBcandidate.
|d0|max-sig. Significance of the larger absolute value of the impact parameters to the PV of the tracks forming theBcandidate, in the transverse plane.
|d0|min-sig. Significance of the smaller absolute value of the impact parameters to the PV of the tracks forming theBcandidate, in the transverse plane.
Pmin
L Value of the smaller projection of the momenta of the muon candidates along−→ pTB. I0.7 Isolation variable defined as ratio of|−→
pTB|to the sum of|−→
pTB|and of the transverse momenta of all additional tracks contained within a cone of size∆R<0.7 around theBdirection. Only tracks matched to the same PV as theBcandidate are included in the sum.
DOCAxtrk DOCA of the closest additional track to the decay vertex of theBcandidate. Tracks matched to a PV different from theBcandidate are excluded.
Nclose
xtrk Number of additional tracks compatible with the decay vertex (DV) of theBcandidate with ln(χ2xtrk,DV)<1. The tracks matched to a PV different from theBcandidate are excluded.
χ2µ,
xPV Minimum χ2 for the compatibility of a muon in theBcandidate with any PV reconstructed in the event.
the distributions of
pTand
|η|of the dimuon and of the pile-up observed in data. The BDT training is done using TMVA [32].
Since sideband data are used for the BDT training and optimisation, the sample is subdivided into three randomly selected separate and equally populated sub-samples used in turn to train, verify and calibrate the selection efficiency of three independent BDTs. The resulting BDTs are verified to have performances that are statistically compatible, and are combined in one single classifier in such a way that each BDT is applied only to the part of the data sample not involved in the BDT training.
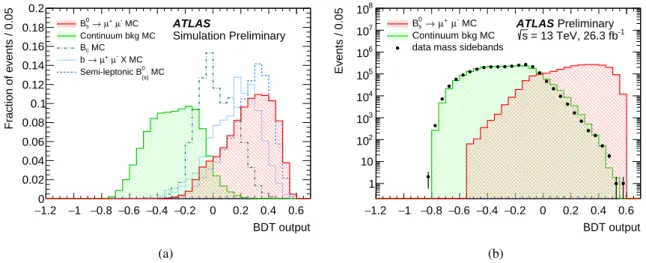
Figure 2 shows the distribution of the BDT output variable for simulated signal and backgrounds, separately
−1.2 −1 −0.8 −0.6 −0.4−0.2 0 0.2 0.4 0.6 BDT output 0
0.02 0.04 0.06 0.08 0.1 0.12 0.14 0.16 0.18 0.2
Fraction of events / 0.05
ATLAS
Simulation Preliminary
- MC µ µ+
→
s
B0
Continuum bkg MC MC
Bc
X MC µ-
µ+
→ b
(s) MC Semi-leptonic B0
(a)
−1.2 −1 −0.8 −0.6 −0.4 −0.2 0 0.2 0.4 0.6 BDT output 1
10 102
103
104
105
106
107
108
Events / 0.05
ATLAS Preliminary = 13 TeV, 26.3 fb-1
s
- MC µ µ+ s→ B0
Continuum bkg MC data mass sidebands
(b)
Figure 2: BDT distribution for the signal and background events after the preliminary selection and before applying any reweighting to the BDT input variables: (a) simulation distributions forB0s→ µ+µ−signal, continuum, partially reconstructedb→µµXevents andBcdecays; (b) dimuon sideband candidates (including also prompt contributions, predominantly at lower BDT values and not simulated in the continuum MC sample), compared with the continuum MC sample and the simulated signal. All distributions are normalised to unity in (a) and to data sidebands in (b).
for continuum background and partially reconstructed events. Also shown is the BDT distribution for dimuon candidates from data, from the sidebands of the invariant mass distribution.
The BDT has been verified not to show any significant correlation with the dimuon invariant mass. The final selection requires a BDT output value larger than 0
.1439, corresponding to signal and continuum background efficiencies of 72% and 0.3% respectively. The analysis will use all candidates after this selection, however the
B0(s) → µ+µ−signal fit has been verified to be insensitive to the signal for candidates with BDT output value smaller than 0.2455 (corresponding to 54% and 0.03% efficiencies for signal and background respectively).
Signal and reference channel yields and efficiencies will be - for this reason - measured relative to the latter signal reference cut, while maintaining the looser selection in order to improve the background modelisation.
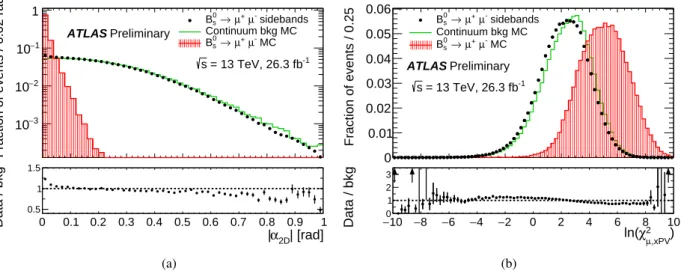
8 Data–simulation comparisons
Figure 3 compares the distributions of two discriminating variables in the continuum background MC sample with data in the dimuon sidebands. Agreement with the sideband data is fair and the discrepancies observed do not compromise the use of this MC background sample for the choice of the background models in the signal fit. The functional parameterization of the backgrounds as a function of the BDT selection has been investigated in data and shown to be consistent with simulation, even for lower BDT values, where prompt backgrounds contribute significantly. The normalization of the backgrounds is not tied to the simulation and is extracted purely from data. The continuum MC simulation is not used for BDT training, computation of efficiencies or normalisation purposes.
The distributions of the discriminating variables are also used for the comparison of
B+ → J/ψK+and
0 0.1 0.2 0.3 0.4 0.5 0.6 0.7 0.8 0.9 1
Fraction of events / 0.02 rad
−3
10
−2
10
−1
10 1
ATLAS Preliminary
= 13 TeV, 26.3 fb-1
s
sidebands µ-
µ+ s→ B0
Continuum bkg MC
- MC µ µ+ s→ B0
| [rad]
α2D
|
0 0.1 0.2 0.3 0.4 0.5 0.6 0.7 0.8 0.9 1
Data / bkg
0.5 1 1.5
(a)
−10 −8 −6 −4 −2 0 2 4 6 8 10
Fraction of events / 0.25
0 0.01 0.02 0.03 0.04 0.05 0.06
ATLAS Preliminary = 13 TeV, 26.3 fb-1
s
sidebands µ-
µ+ s→ B0
Continuum bkg MC
- MC µ µ+ s→ B0
,xPV)
µ
χ2
10 ln(
− −8 −6 −4 −2 0 2 4 6 8 10
Data / bkg 0
1 2 3
(b)
Figure 3: Data and continuum MC distributions of the (a)|α2D|and (b) ln
χ2µ,xPV
variables (defined in Table1).
The points correspond to the sideband data, while the continuous-line histogram corresponds to the continuum MC distribution, normalised to the number of data events. The filled-area histogram shows the signal MC distribution for comparison. The bottom insets report the data/MC ratio, zoomed in order to highlight discrepancies in the region that is most relevant for the analysis.
B0s → J/ψ φ
events between simulation and data. To perform such comparison, for each variable the contribution of the background is subtracted from the signal. For this purpose, a maximum-likelihood fit is performed to the invariant mass distribution, separately in bins of rapidity and transverse momentum.
The fit model used is simpler than the one employed for the extraction of the
B+signal for normalisation as described in Section 9, but is sufficient for the purpose discussed here.
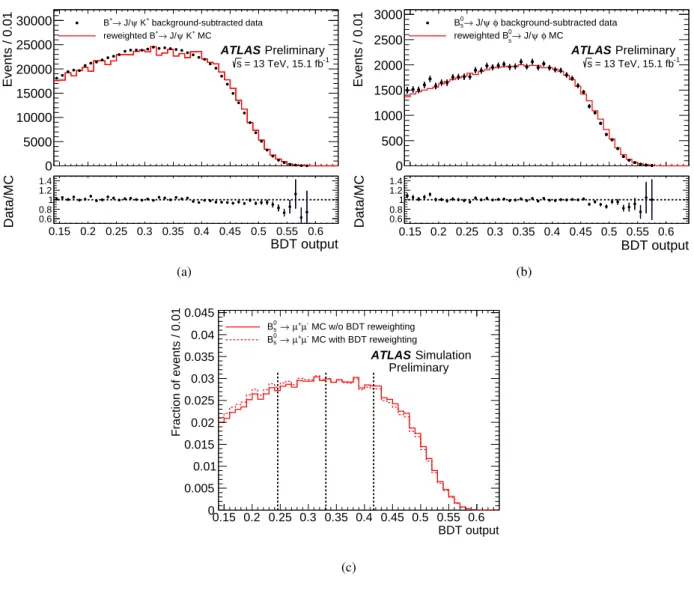
Figure 4 shows examples of the distributions of the discriminating variables obtained from data and simulation for the reference samples. Observed differences are accounted for as systematic effects with the procedure described in Section 10. The discrepancy shown for the isolation variable
I0.7in the
B+→J/ψK+channel is the most significant one among all variables and both reference channels.
9 Yield extraction for the normalisation channel B
+→ J/ψ K
+The
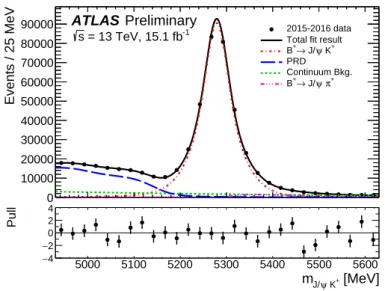
B±yield for the normalisation channel is extracted with an unbinned extended maximum-likelihood fit to the
J/ψK±invariant mass distribution of half of the available events. The functional forms used to model both the signal and the backgrounds are obtained from studies of MC samples. All the yields are extracted from the fit to data, while the shape parameters are determined from a simultaneous fit to data and MC samples. Free parameters are introduced for the mass scale and mass resolution to accommodate data–MC differences. The fit yields a negligible increase in resolution and a mass shift at the level of 2 MeV.
The fit includes four components:
B+ → J/ψK+events, Cabibbo-suppressed
B+ → J/ψ π+events on
the right tail of the main peak, partially reconstructed
Bdecays (PRD) where one or more of the final-state
particles are missing, and the continuum background composed mostly of
bb¯
→ J/ψXevents. All
0 0.1 0.2 0.3 0.4 0.5 0.6 0.7 0.8 0.9 1
Events / 0.02
102
103
104
105
106
background-subtracted data K+
ψ
→ J/
B+
+ MC ψ K
→ J/
B+
ATLAS Preliminary = 13 TeV, 15.1 fb-1
s
| [rad]
α2D + | ψ K
→ J/
B+
0 0.1 0.2 0.3 0.4 0.5 0.6 0.7 0.8 0.9 1 Data/MC 0
0.5 1 1.5 2
(a)
−4 −2 0 2 4 6 8 10 12
Events / 0.30
0 10000 20000 30000 40000 50000
60000 B+→ J/ψ K+ background-subtracted data
+ MC ψ K
→ J/
B+
ATLAS Preliminary = 13 TeV, 15.1 fb-1
s
PV,DV xy) χ2 + ln(
ψ K
→ J/
B+
−4 −2 0 2 4 6 8 10 12
Data/MC 0 0.5 1 1.5 2
(b)
0 0.2 0.4 0.6 0.8 1
Events / 0.02
102
103
104
105 B+→ J/ψ K+ background-subtracted data
+ MC ψ K
→ J/
B+
ATLAS Preliminary = 13 TeV, 15.1 fb-1
s
I0.7
K+
ψ
→ J/
B+
0 0.2 0.4 0.6 0.8 1
Data/MC 0 0.5 1 1.5 2
(c)
0 0.2 0.4 0.6 0.8 1
Events / 0.02
1 10 102
103
104 Bs→ J/ψφ background-subtracted data φ MC
ψ
→ J/
Bs
ATLAS Preliminary = 13 TeV, 15.1 fb-1
s
I0.7
φ ψ
→ J/
s
B0
0 0.2 0.4 0.6 0.8 1
Data/MC 0 0.5 1 1.5 2
(d)
Figure 4: Data and MC distributions in B+ → J/ψK+ events for the discriminating variables: (a) |α2D|, (b) ln
χ2PV,DV x y
and (c) I0.7. The variable I0.7 is also shown in (d) for B0s → J/ψ φevents. The black points correspond to the sideband-subtracted data, while the red histogram corresponds to the MC distribution, normalised to the number of data events. Differences in shape between MC events and data are accounted for as systematic effects, as discussed in the text. The discrepancy shown forI0.7in theB+→ J/ψK+channel is the most significant among all variables and both reference channels. The bottom insets report the data/MC ratio, zoomed in order to highlight discrepancies in the region that is most relevant for the analysis.
components other than the last one have shapes constrained from MC simulation as described below, with
the data fit including an additional gaussian convolution to account for possible data-MC discrepancies in
mass scale and resolution. The shape of the
B+→ J/ψK+distribution is parameterised using a Johnson
SUfunction [33, 34]. The final
B+ → J/ψK+yield includes the contribution from radiative
B±decays
(i.e. where photons are emitted from the
Bdecay products). The
B+ → J/ψ π+events are modelled
by the sum of a Johnson
SUand a Gaussian function, where all parameters except the normalisation are
determined from the simulation. The decay modes contributing to the PRD are classified in simulation
on the basis of their mass dependence. Each of the three resulting categories is contributing to the
Mass (MeV)
Events / 25 MeV
0 10000 20000 30000 40000 50000 60000 70000 80000
90000 2015-2016 data
Total fit result K+
ψ
→ J/
B+
PRD Continuum Bkg.
π+
ψ
→ J/
B+
ATLAS Preliminary = 13 TeV, 15.1 fb-1
s
[MeV]
K+
ψ
mJ/
5000 5100 5200 5300 5400 5500 5600
Pull
−4
−2 0 2 4
Figure 5: Result of the fit to theJ/ψK±invariant mass distribution for allB±candidates in half of the data events.
The various components of the spectrum are described in the text. The inset at the bottom of the plot shows the bin-by-bin pulls for the fits, where the pull is defined as the difference between the data point and the value obtained from the fit function, divided by the error from the fit.