J. Perinat. Med.
16 (1988)
Assessment of pulmonary dynamics in normal newborns:
a pneumotachographic method
Paul Estol, Hector Piriz, Luis Pintos, Fernando Nieto, and Franco Simini
Latin-American Center of Perinatology and Human Development, Montevideo, Uruguay
1 Introduction
The functional diagnosis of the different forms of respiratory distress in the newborn infant, and assessment of the need for different methods of respiratory assistance, are mainly based on physi- cal examination, X-rays and arterial blood gas analysis.
Mechanical ventilatory assistance is now widely accepted as an effective therapy for respiratory failure in the neonate. Its correct application re- quires a knowledge of the mechanical abnormali- ties of the infant's lung. Insufficient ventilatory support can overtax the inadequate ventilatory system of the sick neonate. On the other hand, excessive ventilatory support increases the risk of respiratory complications, such as pulmonary interstitial emphysema, pneumothorax, and bron- chopulmonary dysplasia.
At present, ventilatory settings are made by trial and error. Different settings are tried until the desired clinical and arterial blood gas measure- ments are obtained. This method, though widely used, has important limitations. Firstly, the clini- cal results are only indirectly related to the physio- logical variable of the system i.e. pulmonary venti- lation. Secondly, blood gas analysis being inter- mittent does not easily allow one to appreciate trends nor abrupt changes in the respiratory state of the neonate.
To achieve better knowledge of the mechanical variables involved in the different forms of respir- atory distress of the newborn infant, we have developed a pneumotachographic method to determine pulmonary dynamics in newborns. This
Curriculum vitae PAUL ESTOL M.D., was bom in 1952. He graduated as a medical doctor at the Faculty of Medicine of Montevideo, Uruguay in 1981. Since 1979 he has worked in perinatal investi- gation at the Faculty of Medicine of Montevideo and at the Centro Latino- americano de Perinatolo- gia ( P AHO I WHO). His
special interest include fetal and neonatal respiratory phy- siology. Since 1982 he has worked as a clinical neonatolo- gist in the Neonatal Intensive Care Unit of the Faculty of Medicine of Montevideo, Uruguay, and since 1984 he has been a neonatologist of the Centro Latinoamericano de Perinatologia (PAHO/WHO). The present project has been developed in, and with the assistance of both institutions.
helps to make a functional diagnosis and to select treatment in those cases needing mechanical venti- lation.
Before the results obtained with this method can be applied, the normal neonatal range has to be established. Information concerning normal pulmonary dynamics of the newborn has been available since the early '50s, but most of these are from studies performed using plethysmographic methods, which are not comparable to the method we have used. Thought two reports used a pneu- motachographic method [11, 12], the results still should not be compared, due to minor technical
with a given method, against the "normal values"
obtained with a different method, may be cause of error, and result in false conclusions.
We have determined the pulmonary dynamic data of a group of term and preterm normal infants in order to establish the range of normal values with our method, and to compare them with the results obtained by other authors. These values will be of great assistance in the interpretation of results encountered in infants with respiratory distress, when using this instrumentation.
2 Material and methods
Normal term and preterm newborns, born at the Clinica Ginecotocologia "B" of the Faculty of Me- dicine in Uruguay, in the period between March 1984 and December 1985 were studied. Informed consent was obtained from the mother prior to per- forming any measurement in the newborn. They were admitted to the neonatal intensive care unit where all studies were carried out and were exam- ined by a neonatologist (one of the authors). New- borns with any pathology were not included in the study. The measurements were made with the in- fants prone or supine nursed in the same conditions as they had been just before. All infants breathed air during the determinations. More than 1 hour had elapsed since the last feed. A water-filled, ster- ile, end hole polyethylene catheter, was placed in
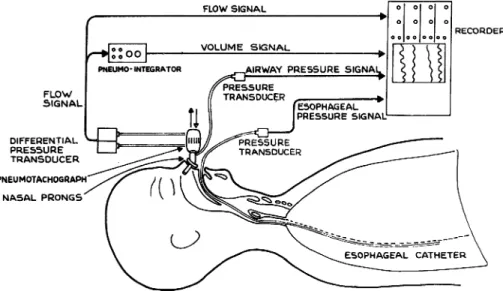
nected to a Sanborn Model 269A pressure trans- ducer, to record esophageal pressure (Pes) (figure 1). Patency was maintained with an intraflow (R) system using a continuous flow of sterile distilled water. Once the baby tolerated the esophageal cath- eter, a pair of nasal prongs normally used for con- tinuous positive pressure, or an inflatable face mask were gently applied. The baby would initially react adversely, but in a few minutes, would grow accustomed and finally breathe regularly. The prongs or mask were connected to an electrically heated grid pneumotachograph, constructed in our laboratory, and attached to a differential pres- sure transducer (Sanborn Model N°270) with which airflow (F) was measured in a range of 0 to 198 ml/s.
The flow signal was electronically integrated with time, using an integrator constructed in our lab- oratory. A volume signal (V) was produced (figure 1). At the nasal prongs, or at the face mask, distal to the pneumothacograph, an opening in the lumen of the system allowed the passage of a catheter attached to a model 268B Sanborn pres- sure transducer used to assess the airway pressure (Paw) (figure 1). These four signals: F, V, Paw, Pes, were simultaneously recorded on a Sanborn 7700 Series multichannel recorder (figure 1). Once all components were connected, and adequate sig- nals were obtained on the recorder, we waited until the newborn entered a period of regular
FLOW SIGNAL
RECORDER
DIFFERENTIAL PRESSURE TRANSDUCER PNEUMOTACHOGRAPH
NASAL PRONGS'
Figure 1. Pneumotachographic method used in the determination of pulmonary dynamic data.
AIRWAY FLOW
Onl/S)
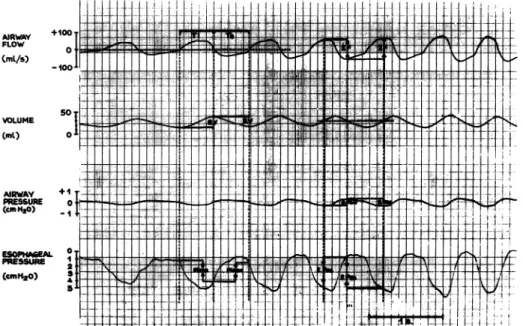
Figure 2. Tracing of flow (F), volume (V), airway pressure (Paw) and esophageal pressure (Pes), obtained at a speed of 50 mm/s.
respiration, usually in quiet sleep. When a regular pattern of respiration was present, the recorder was started using a chart paper speed of 50 mm/
s. Ten successive respiratory cycles were recorded in which the following variables were determined (figure 2).
2.1 Breathing frequency (1)
T is the cycle duration which is taken to be the time interval separating the start of successive breathing cycles. The start of a breath is defined as the positive deflection from zero on the air flow record.
T is the mean of 10 determinations of T. T is given in seconds.
f, the respiratory frequency, is calculated by:
f = 60 (s/min)/T (s)
= 60/T (1/min)
2.2 Tidal volume and dynamic compliance (Cdyn) Dynamic compliance can be thought of as the ability of the respiratory system to store energy to be used later in the cycle. It is estimated by the ratio of the tidal volume and the esophageal pressure at moments of zero flow. On the air flow record, all points of zero flow are marked. They
alternately represent end-expiration and end-in- spiration. These are projected on the volume re- cord and on the esophageal pressure record (figure 2).
V is the amplitude of the volume record. 2V is the peak to peak excursion measured between the end-inspiration and end-expiration points.
VT, is the tidal volume, and is the mean of 10 determinations of 2V. VT is expressed in ml.
Pinex is the excursion of the esophageal pressure record taken between end inspiration and end expiration points.
Pinex is the mean of 10 determinations of Pinex.
Pinex is expressed in cm thO.
Cdyn, the dynamic compliance, is calculated by:
Cdyn = VT/Pinex (ml/cmH2O) 2.3 Minute ventilation (V)
Having determined f, the respiratory frequency, and VT, then the minute ventilation V is given by:
V = f VT (ml/min)
2.4 Total pulmonary resistance (R)
Total pulmonary resistance, R, can be thought of as the ratio between a driving force and the result-
J. Perinat. Med. 16 (1988)
stored during part of the cycle. The driving force is the difference between the pressure in the airway and the pressure in the esophagus. Since all the signals considered are periodic we represent them for simplicity as purely sinusoidal to estimate R.
R is given by the ratio of the pressure difference amplitude and the airflow amplitude. We chose the airflow signal as the reference, since it approx- imates to a sinusoidal signal better than the pres- sure signals (figure 2). The points of maximum and minimum flow are determined easily by the mid points of the volume signal. These points are taken to represent zero, though the value is posi- tive because of the integration constant.
F is the amplitude of the airflow signal between successive mid volume points (figure 2).
F is the mean of 10 determinations of F.
Pes is the amplitude of the esophageal pressure signal. 2 Pes is the peak to peak excursion mea- sured between successive mid volume points (figure 2).
Pes is the mean of 10 determinations of Pes.
Paw is the amplitude of the airway pressure signal.
2 Paw is the peak to peak excursion measured between successive mid volume points (figure 2).
Paw is the mean of 10 determinations of Paw.
R is calculated by:
R = (Pes - Paw)/F (cm H2O/l/s)
R represents the amplitude pressure difference needed to obtain a flow of 1 litre per second.
2.5 Respiratory work
The mechanical energy necessary to perform one breathing cycle is called "total respiratory work".
It is given by the mathematical integration, over the duration of one cycle, of the product of the difference of pressure (airway and esophagus) and the resulting airflow signal.
It is customary to ignore the airway pressure which is an order of magnitude smaller than the esophageal pressure. Therefore the work is given by the integral of flow and esophageal pressure:
W = integral V Pes dt (cm thO min ml/min) But V dt is the time differential of the volume signal:
dV = V dt
1 2 3 4 5
PRESSURE CcmH20) Figure 3. Pressure-volume loop. Area ABC represents elastic respiratory work (We). Area enclosed in the loop represents inspiratory (I) and expiratory (II) flow resis- ting work (Wv). Assuming that expiration is passive, total pulmonary work (Wt) is represented by the sum of elastic work (We) plus inspiratory flow resistive work (I).
In other words, work can be estimated as the integral of Pes with respect to V instead of with respect to time t:
W = integral Pes dV
The representation of a breathing cycle showing Pes as a function of V is known as a pressure- volume loop (figure 3). The area ABC represents the elastic respiratory work (We). The area enclosed in the pressure volume loop, represents inspiratory (I) and expiratory (II) flow resistive work (Wv) performed during the respiratory cycle.
Assuming that expiration is passive, total pul- monary work (Wt) is represented by the sum of elastic work (triangle ABC), plus the inspiratory flow resistive work (I) [6]. These respective areas were calculated with a disc roller planimeter. The obtained value, when multiplied by frequency and divided by 60, gave the energy consumed per second, which was expressed in mW. This value is represented, so as to facilitate comparison as mW divided by minute ventilation (mW/V).
Tidal volume, minute ventilation, dynamic com- pliance and total pulmonary resistance were lin- early correlated with body weight using a multiple regression method. A critical value of alpha less than 0.05 was considered as significant.
The values of tidal volume (VT), minute ventila- tion (V), and dynamic compliance (Cdyn) were corrected for body weight. The mean (X) and standard deviation (SD) were calculated for each variables as well as the 10th and 90th percentiles, using a table of Z values.
Before each study, all signals were calibrated, F with an electric signal, V with a 50 ml glass sy- ringe, and pressure with a water manometer.
3 Results
A total of 51 records were obtained in 48 new- borns. In three infants two records each were obtained, after an interval of one week. The post-
Table I. Corrected gestational age of the infants at the times they were studied
Gestational age (weeks)
<30 31-34 35-36
^37
Records (n)
29 8 32
Table II. Body weight of the infants at the times they were studied
Body weight Records
(n) 1000-1499
1500-1999 2000-2499 2500-2999 3000-3499
^3500
9 115 12
natal age of the newborns when studies were per- formed ranged between 24 hours and 21 days.
Nineteen records were obtained in preterm (< 31 weeks gestational age) and 32 in term infants. The corrected gestational ages of the infants at the time of the study is shown in table I.
Twenty six records were obtained in low birth weight infants (<2500g), and 25 in infants weighing more than 2500 g. The body weights of the infants at the time of the study are shown in table II.
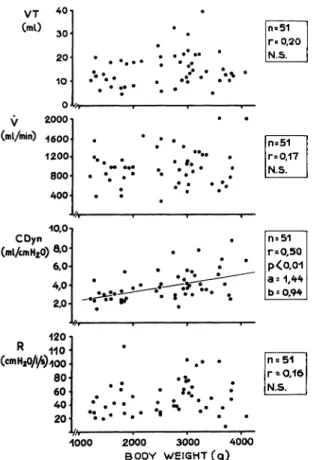
Tidal Volume (VT): No significant correlation was found between VT and body weight (r = 0.20, NS) (figure 4). The VT/Kg in the 51 records was 6.28 ±3.17 ml/Kg (X ± SD), with the 10th cen- tile 2.21 and the 90th centile 10.34 (table III, figure 4).
Minute ventilation (V): No correlation was found between V and body weight (r = 0.17, NS) (figure 4). The V/Kg in the 51 records was 425.3 ± 220.3 ml/min/Kg, with the 10th centile 142.9 and the 90th centile 707.7 (table III, figure 4).
Dynamic compliance (Cdyn): A positive correla- tion was obtained between Cdyn and body weight (r = 0.50, p < 0.01) (figure 4). The Cdyn/Kg body weight value in the 51 records was 1.57
± 0.57 ml/cm H2O/Kg, with the 10th centile 0.84 and the 90th centile 2.30 (table III, figure 4).
Total pulmonary resistance (R): No correlation was found between R and body weight (r = 0.16, NS) (figure 4). The R value in the 51 records was 51.1 ± 26.1 cmH2O/l/s, with the 10th centile 17.6 and the 90th centile 85.6 (table III, figure 4).
Total respiratory work (Wt): Determination of res- piratory work was only performed in 40 of the 51 records. The Wt in these 40 records was 8.65
± 3.59 mW/1/Kg/min, with the 10th centile 4.05 and the 90th centile 13.25 (table III).
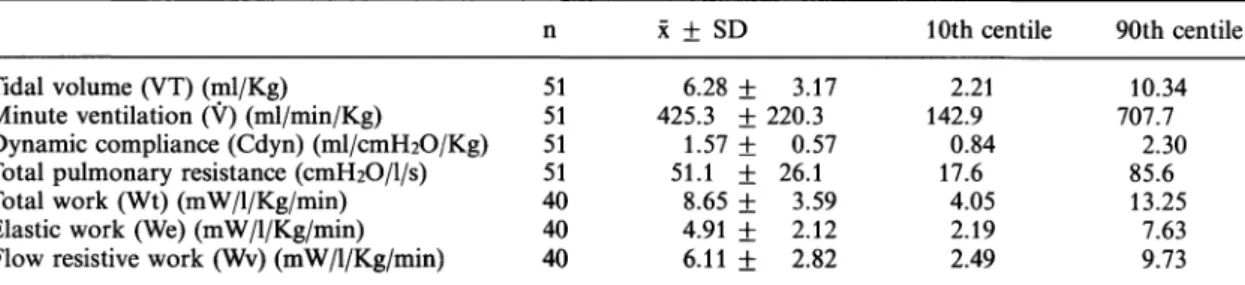
Table III. Values for pulmonary dynamics in a population of term and preterm infants
χ ± SD 10th centile 90th centile Tidal volume (VT) (ml/Kg)
Minute ventilation (V) (ml/min/Kg)
Dynamic compliance (Cdyn) (ml/cmH2O/Kg) Total pulmonary resistance (cmFhO/l/s) Total work (Wt) (mW/1/Kg/min) Elastic work (We) (mW/1/Kg/min) Flow resistive work (Wv) (mW/1/Kg/min)
51 5151 5140 4040
6.28 ± 3.17 425.3 + 220.3
1.57 + 0.57 51.1 ± 26.1
8.65 ± 3.59 4.91 + 2.12 6.11 + 2.82
2.21 142.9
17.60.84 4.05 2.192.49
10.34 707.7
85.62.30 13.25
7.639.73
J. Perinat. Med. 16 (1988)
(ml) 3Q
20 10 Ο
γ 2000 (ml/min) ^60o 1200 800 400
COyn (ml/emH20) '
10,0
6.0 4,0 2.0-
. , ·
r =0,50 p<0,01 a* 1,4*
120 i
R 110-
(cmH20/l/s),,oo.
80- 60- 40 20-
.-·. · '*'.. :
Γ = 0,16N.S.1000 2000 3000 4000 BODY WEIGHT (g)
Figure 4. Values for VT, Cdyn and R correlated against body weight.
Elastic work (We): In these 40 records elastic work was 4.91 + 2.12 mW/1/Kg/min. with the 10th cen- tile 2.19 and the 90th centile 7.63 (table III).
Flow resistive work (Wv): In these 40 records flow resistive work was 6.11 ± 2.82 mW/1/Kg/min with the 10th centile 2.49 and the 90th centile 9.73 (table III).
4 Discussion
The determination of a normal range of values of pulmonary dynamics in newborns is a necessary first step toward the correct interpretation of those results obtained using new techniques in infants with respiratory distress.
Although various reports of pulmonary dynamics in normal newborns have been published to date (table IV), only 2 of them have used a pneumota- chographic method [11, 12]. In both reports, al-
way, the assessment of esophageal pressure is per- formed using a catheter with a latex balloon, which could have produced different results from our study which employed a water-filled catheter.
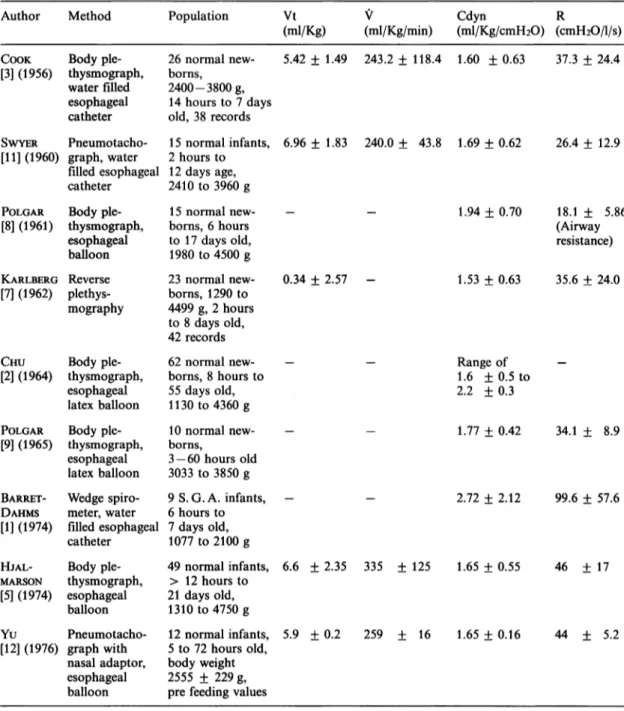
The values for Cdyn/Kg found in the present study (1.57 ± 0.57 ml/cmH2O/Kg) (X ± SD) are similar to those found by SWYER et al. [11] (1.69
± 0.62) and by Yu et al. [12] (1.65 ± 0.16), both using a pneumotachographic method. Our values for resistance (51.6 + 26.1 cm HiO/l/s) are some- what higher than those found by SWYER et al. [11]
(26.4 + 12.9), but similar to those found by Yu et al. [12] (44. ± 5.2). The values for VT/Kg are very similar to these three reports in which pneu- motachographic is used. We have found a greater value for V/Kg, than those reported by the pre- viously mentioned authors. It also is greater when compared with other authors who used plethis- mography [3, 5, 7]. Some of the possible explana- tions for this finding are:
1) Excessive dead space in those cases in which a face mask was used.
2) The effect of the nocioceptive stimulus pro- duced by an inadequate application of the face mask or nasal prongs to the infant's face.
3) Inappropriate choice of the time the recording was made.
A time period which comprises only 10 cycles is very short and may easily be unrepresentative of what happens under basal conditions. Minute volumes in this study cannot be considered as basal. Minimal minute volumes may not be reached until the infant has been asleep for periods greater than 1 Hour [11]. This is supported by the fact that in our study the 31 infants in whom a face mask was used had a V/Kg of 534,2 ± 210,6 ml/Kg/min. (X ± SD), which was significatively higher than that found in the 20 infants in whom nasal prongs were used (265.5 + 90.0 ml/min/Kg) (t = 5.56, p < 0.005). This could also explain the unexpected lack of correlation found between V and VT with body weight.
Once these results were obtained, we discarded the face mask and used only nasal prongs. We also started to take greater precautions with their application to the infant's nose, at the time we made our recordings. Our V/Kg and VT/Kg values should thus be interpreted with caution.
Our results are encouraging because our values of Cdyn/Kg, R and VT/Kg are in accord with those
Table IV. Pulmonary dynamic values reported in the literature, (S. G. A. = Small for Gestational Age)
(All values are X ± l S. D.)
and recalculated with correction for body weight.
Author Method Population Vt V Cdyn R
(ml/Kg) (ml/Kg/min) (ml/Kg/cmH2O) (cmH2O/l/s) COOK[3] (1956) Body ple-
thysmograph, water filled esophageal catheter
26 normal new- borns,
2400-3800 g, 14 hours to 7 days old, 38 records SWYER Pneumotacho- 15 normal infants, [11] (1960) graph, water 2 hours to
filled esophageal 12 days age, catheter 2410 to 3960 g POLGAR Body ple-
[8] (1961) thysmograph, esophageal balloon KARLBERG Reverse [7] (1962) plethys-
mography
CHU Body ple- [2] (1964) thysmograph,
esophageal latex balloon POLGAR Body ple- [9] (1965) thysmograph,
esophageal latex balloon
15 normal new- borns, 6 hours to 17 days old, 1980 to 4500 g 23 normal new- borns, 1290 to 4499 g, 2 hours to 8 days old, 42 records 62 normal new- borns, 8 hours to 55 days old, 1130 to 4360 g 10 normal new- borns,
3-60 hours old 3033 to 3850 g BARRET- Wedge spiro- 9 S. G. A. infants, DAHMS meter, water 6 hours to [1] (1974) filled esophageal 7 days old,
catheter 1077 to 2100 g HJAL-
MARSON
[5] (1974)
Body ple- thysmograph, esophageal balloon
49 normal infants,
> 12 hours to 21 days old, 1310 to 4750 g
5.42 ± 1.49 243.2 ±118.4 1.60 ± 0.63 37.3 ± 24.4
6.96 ± 1.83 240.0 ± 43.8 1.69 ± 0.62 26.4 ± 12.9
1.94 ± 0.70
0.34 ± 2.57 - 1.53 ± 0.63
Range of 1.6 ±0.5 to 2.2 ±0.3
18.1 ± 5.86 (Airway resistance) 35.6 ± 24.0
1.77 ± 0.42 34.1 ± 8.9
2.72 ± 2.12 99.6 ± 57.6
6.6 ± 2.35 335 ± 125 1.65 ± 0.55 46 ± 17
Yu Pneumotacho- [12] (1976) graph with
nasal adaptor, esophageal balloon
12 normal infants, 5.9 ± 0.2 5 to 72 hours old,
body weight 2555 ± 229 g, pre feeding values
259 ± 16 1.65 ± 0.16 44 ± 5.2
found by other authors who used both similar [11,12] and different methods [3, 5, 7]. This allows us to continue with the second stage of our pro- gram of respiratory studies in newborns, that is
to apply this method in the study of infants with respiratory distress and use for the adjustment of ventilatory settings in neonates who require assisted ventilation.
J. Perinat. Med. 16 (1988)
most frequently used methods in newborn studies, but its widespread utilization has been hindered by difficulties in applying it in the study of distressed infants whe are dependent on complex systems of life support. This is not the case with pneumotachography, in which the pneumota- chograph is placed between the ventilator and the endotracheal tube adaptor and this with the
only maneuvers performed on the infant. This minimal manipulation, together with the develop- ment of biological signal processing with micro- processors and "on line" computing systems [4], place the pneumotachographic method as best suited for pulmonary dynamic data assessment in infants in the neonatal intensive care unit who have severe distress.
Summary
A pneumotachographic method for assessment of pul- monary dynamics in critically ill newborns in an inten- sive care setting was developed in our laboratory. Before the results obtained with this method could be applied, the normal range of values were determined in 48 normal term and preterm newborns. Their body weight ranged between 1200 and 4100 g, and postnatal ages between 24 hours and 21 days. In three infants, two determina- tions were performed after an interval of 7 days. The studies were performed with a pneumotachograph ap- plied to the upper airway by means of an inflatable face mask or latex nasal prongs. The air flow signal was electronically integrated to time to produce a volume signal. Airway pressure was determined proximal to the pneumotachograph. Esophageal pressure was deter- mined with a water filled catheter placed in the lower third of the esophague.
Tidal volume (VT), minute ventilation (V), Dynamic compliance (Cdyn), total pulmonary resistance (R), total pulmonary work (Wt), Elastic work (We), and flow resistive work (Wv), were determined.
A significant linear correlation was found between Cdyn and body weight (r = 0.50, p < 0.01) whereas no signifi- cative correlation was found between body weight and Keywords: Lung, newborn, pulmonary dynamics.
VT, V or R. Values for VT, V and Cdyn were corrected for body weight and means (X), standard deviation (SD) s_p as 10th and 90th percentiles are shown in table III.
X, SD and percentiles for R were shown in table III.
Wt, We and Wv were corrected for V, and X, SD and percentiles shown in table III. Values of VT/Kg, Cdyn/
Kg and R are similar to those found by other authors with pneumotachography and plethysmography.
The V/Kg values obtained by us were higher than those reported by other authors, which together with the lack of correlation of VT and V with body weight, question the reliability of V values in our study. This could be explained by:
1) excessive increase in dead space in cases in which a face mask was used;
2) nocioceptive stimulus produced by face mask or nasal prongs;
3) inadequate selection of the moment at which the record was obtained.
Whichever the explanation, our values of V cannot be considered as basal, and should be interpreted with caution. The results obtained allow us to continue with our program and apply this method to the study of newborn infants with RDS.
Zusammenfassung
Bestimmung der Lungendynamik bei gesunden Neugebore- nen durch Pneumotachographie
Wir entwickelten eine pneumotachographische Methode zur Bestimmung der Lungendynamik bei schwerkran- ken, intensivüberwachten Neugeborenen. Bevor diese Methode angewendet werden kann, ist die Erhebung von Normalwerten an einem gesunden Kollektiv notwendig.
Dieses bestand aus 48 Reif- und Frühgeborenen mit einem Geburtsgewicht zwischen 1200 und 4100 g im Alter zwischen 24 h und 21 Tagen. Bei 3 Kindern wurden jeweils 2 Messungen im Abstand von 7 Tagen durchge- führt. Der Pneumotachograph wurde mittels einer auf- blasbaren Gesichtsmaske oder Latex-„Nasenspitzen"
mit den oberen Luftwegen verbunden und das Flow- Signal wurde elektronisch über die Zeit integriert zur
Erstellung eines Volumensignals. Der Druck in den Luft- wegen wurde proximal des Pneumotachographen abge- leitet, der Ösophagusdruck mit einem wassergefüllten Katheter im unteren Speiseröhrendrittel gemessen.
Bestimmt wurden Strömungsvolumen (VT), Minuten- ventilation (V), dynamische Compliance (Cdyn), Atem- wegswiderstand (R), Atmungsarbeit (Wt), elastische Ar- beit (We) und Strpmungswiderstand (Wv).
Zwischen Cdyn und Geburtsgewicht fand sich eine signi- fikante lineare Korrelation (r = 0.50, p < 0.01), jedoch keine zwischen Geburtsgewicht und VT, V oder R. Die Werte für VT, V und Cdyn wurden für das Geburtsge- wicht korrigiert, Tabelle III zeigt Mittelwerte (X), die Standardabweichung (SD) sowie die 10er und 90er Per- zentile und ebenso die Kurven für R. Weiterhin zeigt
Tabelle III die Mittelwerte, Standardabweichung und Perzentilen für Wt, We und Wv nach Korrektur für V.
Die Werte VT/kg, Cdyn/kg und R sind denen anderer Autoren, die mit Pneumotachographie und Plethysmo- graphie gearbeitet haben, vergleichbar.
Die V/kg-Werte sind in unserer Studie größer als die anderer Autoren. Zusammen mit der fehlenden Korrela- tion zwischen VT und V und dem Geburtsgewicht muß die Reliabilität der V-Werte unserer Studie angezweifelt werden. Mögliche Erklärungen sind:
Schlüsselwörter: Lunge, Lungendynamik, Neugeborenes.
1) Exzessive Zunahme des Totraums bei Fällen, in denen eine Gesichtsmaske benutzt wurde;
2) Stimulierung von Schmerzrezeptoren durch die Ge- sichtsmaske oder Nasenbefestigung;
3) inadäquater Zeitpunkt der Aufzeichnung.
Wie auch immer die Erklärung — unsere V-Werte sollten nicht als Basis zugrunde gelegt werden, sondern sind mit Vorsicht zu interpretieren. Insgesamt ermöglicht unsere Vorarbeit, das Programm fortzusetzen und bei Neugebo- renen mit RDS anzuwenden.
Resume
Appreciation de la dynamique pulmonaire chez les nouveaux-nes normaux: methode pneumotachographique
*Nous avons mis au point dans notre laboratoire une methode pneumotachographique pour apprecier la dy- namique pulmonaire chez les nouveaux-nes en situation critique dans les services de soins intensifs. Nous avons determine les valeurs normales chez 48 nouveaux-nes normaux, ä terme et prematures, avant que les resultats obtenus par cette methode puissent etre utilises. Les poids de naissance allaient de 1200 ä 4100 g et les äges utilises. Les poids de naissance allaient de 1200 ä 4100 g et les äges postnataux etaient compris entre 24 heures et 21 jours. Chez trois enfants on a realise deux determi- nations a 7 jours d'intervalle. L'etude a ete realisee ä I'aide d'un pneumotachographe mis en place sur les voies aeriennes superieures au moyen d'un masque facial a extension ou de sondes nasales en latex. Le signal de flux aerien est integre electroniquement au temps pour produire un signal de volume. La pression des voies aeriennes est determinee a proximite du pneumota- chographe. La pression oesophagienne est determinee a 1'aide d'un catheter rempli d'eau installe au niveau du tiers inferieur de l'oesophage.
On a mesure le volume respiratoire (VT), la ventilation minute (V), la compliance dynamique (C dyn), les resis- tances pulmonaires totales (R), le travail pulmonaire total (Wt), le travail elastique (We) et le travail de resistivite au flux (WV).
On a trouve une correlation lineaire significative entre
la C dyn et le poids corporel (r = 0,50, p < 0,01), alors qu'il n'y a pas de correlation significative entre le poids et le VT, la V et les R. Les valeurs de VT, V et C dyn ont ete corrigees en fonction du poids corporel et les moyennes (X), les deviations standard (DS) ainsi que les lOemes et 90emes percentiles figurent sur le tableau III. X, DS et les percentiles pour R figurent sur le tableau III. Les WT, We et WV ont ete corriges par V, et X, DS et les percentiles figurent sur le tableau III.
Les valeurs de VT/Kg, C dyn/Kg et R sont similaires a celles trouvees par d'autres auteurs utilisant la pneumo- tachographie et la plethysmographie.
Les valeurs de V/Kg que nous avons obtenues sont superieures ä celles rapportees par d'autres auteurs ce qui, joint ä l'absence de correlation de VT et V avec le poids corporel, pose la question de la fiabilite des valeurs de V dans notre etude. Ce fait peut s'expliquer par:
1) Une augmentation excessive de l'espace mort dans les cas pour lesquels un masque facial a ete utilise.
2) Une Stimulus nociceptif provoque par le masque facial ou les sondes nasales.
3) Une selection inadequate du moment d'enregistre- ment.
Quelle que soit l'explication nos valeurs de V ne peuvent etre considerees comme des valeurs de base et on doit les interpreter avec prudence. Les resultats obtenus nous autorisent ä continuer notre programme et ä mettre en oeuvre cette methode pour l'etude des nouveaux-nes presentant un SDR.
Mots-cles: Dynamique pulmonaire, nouveau-ne, poumon.
References
[1] BARRET DAHMS B, A KRAUSS, P AULD: Pulmonary [3]
function in dismature infants. Pediatrics 84 (1974) 434
[2] CHU J, P DAWSON, M KLAUS, A SWEET: Lung compliance and lung volume measured concur- rently in normal full term and premature infants. [4]
Pediatrics 34 (1964) 525
COOK CD, J SUTHERLAND, S SEGAL, R CHERRY, J MEAD, MC ILROY, C SMITH: Studies of respiratory physiology in the newborn infant. Ill Measure- ments of mechanics of respiration. J Clin Invest 36 (1957) 440
CUNNINGHAM MD: Monitoring pulmonary func- tion during mechanical ventilation of infants with RDS. Respir Ther (1983) 47
J. Perinat. Med. 16 (1988)
in newborn infants III. Mechanical and ventilatory lung in newborn infants. J Pediatr 69 (1965) 787 parameters in healthy and diseased newborn in- [10] POLGAR G: Opposing forces to breathing in new- fants. Acta paediatr Scand [Suppl] 247 (1974) 26 born infants. Biol Neonte 11 (1967) 1
[6] KARLBERG P, R CHERRY, F ESCARDO, G KOCH: [11] SWYER P, R REIMAN, J WRIGHT: Ventilation and Respiratory studies in newborn infants. I. Appar- ventilatory mechanics in the newborn. Methods atus und methods for studies on pulonary ventila- and results in 15 newborns. J Pediatr 56 (1960) 612 tion and the mechanics of breathing. Principles of [12] YU VY, P ROLFE: Effect of feeding on ventilation analysis in mechanics of breathing. Acta Paediatr and respiratory mechanics in newborns infants.
Scand (1960) 345 Arch Dis Child 51 (1976) 310 [7] KARLBERG P, G FOCH: Respiratory studies in new-
born infants. Ill Development of mechanics of Received July 8, 1987. Accepted July 22, 1987.
breathing during the first week of life. A longitudi-
nal study. Acta Paediatr Scand [Suppl] 135 (1962) Paul Estol, M.D.
121 Centro Latinoamericano
[8] POLGAR G: Airway resistance in the newborn infant. de Perinatologia y Desarrollo Humano Preliminary communication. J Pediatr 59 (1961) Casilla de Correo 627
915 Hospital de Clinicas P. 16 Montevideo, Uruguay