Research Collection
Journal Article
Drought effects on carbon allocation to resin defences and on resin dynamics in old-grown Scots pine
Author(s):
Rissanen, K.; Hölttä, T.; Bäck, J.; Rigling, A.; Wermelinger, B.; Gessler, A.
Publication Date:
2021-05
Permanent Link:
https://doi.org/10.3929/ethz-b-000472330
Originally published in:
Environmental and Experimental Botany 185, http://doi.org/10.1016/j.envexpbot.2021.104410
Rights / License:
Creative Commons Attribution-NonCommercial-NoDerivatives 4.0 International
This page was generated automatically upon download from the ETH Zurich Research Collection. For more
information please consult the Terms of use.
Environmental and Experimental Botany 185 (2021) 104410
Available online 6 February 2021
0098-8472/© 2021 The Author(s). Published by Elsevier B.V. This is an open access article under the CC BY-NC-ND license
(http://creativecommons.org/licenses/by-nc-nd/4.0/).
Drought effects on carbon allocation to resin defences and on resin dynamics in old-grown Scots pine
K. Rissanen
a,*, T. H ¨ oltt ¨ a
a, J. B ¨ ack
a, A. Rigling
b,c, B. Wermelinger
b, A. Gessler
b,caInstitute for Atmospheric and Earth System Research / Forest Sciences, Faculty of Agriculture and Forestry, Latokartanonkaari 7, University of Helsinki, Helsinki, Finland
bSwiss Federal Institute for Forest, Snow and Landscape Research WSL, Zürcherstrasse 111, 8903, Birmensdorf, Switzerland
cInstitute of Terrestrial Ecosystems, ETH Zurich, Universit¨atsstrasse 16, 8092, Zürich, Switzerland
A R T I C L E I N F O Keywords:
Carbon allocation Drought Irrigation Resin Scots pine Tree defence
A B S T R A C T
Droughts and other rapid changes in abiotic environmental conditions can predispose trees to damage by pest insects and pathogens. For survival of coniferous trees, functional resin-based defences are essential, and it is important to know how they react to changes in environmental conditions at various time scales.
We studied the effects of differing water availabilities on resin-based defences in mature Scots pine (Pinus sylvestris) trees in a naturally drought-prone forest within a long-term irrigation experiment. Our objectives were to understand the effects of long-term drought on carbon allocation to resin production and to analyse its in- fluence on resin flow and pressure in comparison to the shorter-term effects of seasonal drought. We tracked carbon allocation to resin after 13C-pulse labelling experiment in late summer 2017 and compared the observed resin dynamics between drought-exposed control trees and irrigated trees from June to August during the dry hot summer of 2018.
Dry control trees showed higher allocation of labelled carbon to resin than irrigated trees. Resin pressure was higher in dry control than in irrigated trees with similar water potentials, and resin flow in June was higher in dry control than in irrigated trees with similar crown transparency. Yet, resin pressures of dry control trees in particular decreased with decreasing water availability from June to August. Resin flow was little affected by short-term changes in water availability and mostly associated with crown transparency. We suggest that because of differing timescales of direct drought effects and changes in allocation patterns, dry conditions may support resin-based defences in the long term, but a drought period decreases resin pressure in the short term.
1. Introduction
The rapidly altered rainfall patterns, increase in frequency of heat waves, droughts and/or flooding related to climate change pose increasing challenges to many forest ecosystems and can weaken the trees against biotic stresses, such as pathogens or insect pests (Raffa et al., 2008; Ramsfield et al., 2016). The dispersion and reproduction of many pest insect species and their fungal companions are also likely to change, following the rising mean temperatures and increasing avail- ability of susceptible host trees (Raffa et al., 2008; Ramsfield et al., 2016). Thus, the threat of insect invasions and die-back in forests is likely becoming more severe (Schlyter et al., 2006; Raffa et al., 2008;
Wermelinger et al., 2008; Ramsfield et al., 2016), and it is increasingly important to understand how these environmental changes affect tree
defences.
In coniferous trees, the first line of defence against insect pests, such as bark beetles, is their constitutive resin. Resin is a mixture of terpenes with high carbon content (monoterpenes C10, sesquiterpenes C15 and resin acids C20), thus, its production is costly and can involve trade-offs with growth and reproduction (Herms and Mattson, 1992; Lerdau et al., 1994). In defence, resin may act as a chemical defence via its toxic components and as a mechanical barrier by oozing out or repelling in- sects that try to penetrate through the bark or consume the needles (Phillips and Croteau, 1999; Ferrenberg et al., 2015; Krokene, 2015).
Consequently, the rate and amount of resin flowing from wounds, the pressure and composition of resin, and the size and number of resin ducts contribute to conifer tree resistance against bark beetles and their associated pathogens (e.g. Vit´e and Wood, 1961; Hodges et al., 1979;
* Corresponding author. Present address: Universit´e du Qu´ebec a Montr` ´eal, Centre d’´etude de la forˆet, 141 Pr´esident-Kennedy, Montr´eal, QC, H2X 1Y4, Canada.
E-mail address: kaisaarissanen@gmail.com (K. Rissanen).
Contents lists available at ScienceDirect
Environmental and Experimental Botany
journal homepage: www.elsevier.com/locate/envexpbot
https://doi.org/10.1016/j.envexpbot.2021.104410
Received 23 August 2020; Received in revised form 18 January 2021; Accepted 1 February 2021
Raffa and Berryman, 1983; Phillips and Croteau, 1999; Franceschi et al., 2005; Ferrenberg et al., 2014; Celedon and Bohlmann, 2019; Zhao and Erbilgin, 2019; V´azquez-Gonz´ales et al., 2020). In comparison to tree individuals of low resin flow or pressure, trees with high resin flow or elevated resin pressure may be less attractive to bark beetles (Vit´e and Wood, 1961; Raffa and Berryman, 1983; Lieutier et al., 1995). These characteristics can also reduce the insect invasion or reproductive suc- cess (Lieutier et al., 1995; Reeve et al., 1995) and thus reduce the risk of being killed in insect invasions (Hodges et al., 1979; Strom et al., 2002).
Pine species (Pinus L.) have a network of constitutively formed resin ducts that store large amounts of resin (Wu and Hu, 1997; Phillips and Croteau, 1999). In these species, resin pressure within the ducts and the flow of resin from wounds are directly affected by environmental vari- ables, such as temperature and availability of water. Resin pressure follows daily changes in tree water potential under conditions in which the availability of water is limited (e.g. Vit´e, 1961 (P. ponderosa); Lorio and Hodges, 1968 (P. taeda); Neher, 1993 (P. radiata)). The proposed explanations for this relation are that decreasing water potential in the xylem shrinks the tracheids (Helseth and Brown, 1970 (P. elliottii);
Neher, 1993) or that decreasing water potential decreases turgor pres- sure of epithelial cells that line the resin ducts (Vit´e, 1961). Both effects would lead to reduced external pressure to resin ducts when water po- tential decreases. Under moist conditions, resin pressure has been found to follow daily changes in temperature (Rissanen et al., 2016, 2019 (P. sylvestris)). Temperature may increase resin pressure through ther- mal expansion and potentially by increasing the volume of gas bubbles in resin, but the resulting daily variation in resin pressure is small compared to the variation driven by water potential (Rissanen et al., 2019). The cause of the varying daily resin pressure dynamics between dry and moist environments and the potential critical level of water availability or temperature that switches between these dynamics are, however, unclear. Despite the differences in daily dynamics, decrease in water availability appears to reduce resin pressures in both dry and moist environments at longer time scales, e.g. over the growing season (Vit´e, 1961; Lorio and Hodges, 1968; Rissanen et al., 2019). In addition to resin pressure, resin flow has been reported to vary with water availability and to increase with temperature due to decreased viscosity and potentially increased production (e.g. Blanche et al., 1992 (P. taeda); Gaylord et al., 2007 (P. ponderosa); Rodriguez-García et al., 2015 (P. pinaster); Neis et al., 2018 (P. elliotii); Zas et al., 2020 (P. pinaster)).
Water availability may also influence resin flow and pressure via its effects on carbon allocation patterns. According to the growth- differentiation balance framework, when resource availability limits growth more than it limits photosynthesis, the excess carbon produced in photosynthesis may be used for secondary metabolism, e.g. resin production (Herms and Mattson, 1992; Lerdau et al., 1994). Conse- quently, during a moderate drought that does not decrease photosyn- thesis, but limits tree growth due to low turgor pressures or slow substrate transport (Hsiao et al., 1976; Tardieu et al., 2011; Sevanto, 2014), resin storages, resin flow from wounds and thus the constitutive defence capacity of the tree may be higher than during abundant availability of water (Lorio, 1986; Lorio et al., 1995; Lombardero et al., 2000; Hood and Sala, 2015). In contrast, a long-term resource deficiency that severely lowers photosynthesis may decrease the production of secondary metabolites and reduce resin flow (Lorio, 1986; Lorio and Hodges, 1977; Herms and Mattson, 1992; Dunn and Lorio, 1993; Lom- bardero et al., 2000; Gaylord et al., 2013). In addition to constitutive resin flow, induced defence reactions can be affected: for example, Kolb et al. (2019) reported a decrease in induced resin flow even during a moderate drought.
Despite intensive research on resin flow, the growth-differentiation balance framework and the potential carbon allocation effects have, to our knowledge, not been applied to resin pressure changes. Yet, resin pressure changes may have important implications in tree defence ca- pacity (Vit´e, 1961; Vit´e and Wood, 1961). Changes in resin pressure
have also been hypothesised to affect resin flow, because higher resin pressure can be expected to increase the velocity of resin flow out from a wound (Lorio and Hodges, 1977). The correlations between resin flow and resin pressure are, however, often unclear (Lorio, 1994).
The realisation of the growth-differentiation balance may depend on species-specific characteristics, such as, the stomatal control over water use (isohydry and anisohydry) which affects photosynthesis and consequently the amount of available carbon during dry periods. It also depends on the genetic background of the study population (V´azquez-Gonz´ales et al., 2020; Zas et al., 2020) and can thus be used to explain changes in selection pressures and adaptation within and be- tween populations (de la Mata et al., 2017; V´azquez-Gonz´ales et al., 2020; Zas et al., 2020). In the light of the rapid environmental changes, studying the long-term trends in resin dynamics is important at smaller spatial scales, too. It is, however, complicated by the large size and slow turnover of the resin pool (Wilson et al., 1963; Gershenzon et al., 1993).
For example, in pines the constitutive resin flow aggregates many years of resin production (Wu and Hu, 1997; Gaylord et al., 2013). Conse- quently, the potential effects of carbon allocation on resin flow are not necessarily expressed during the same growing season or year, but they may affect the resin flow for several years afterwards. Thus, long-term experiments and separation between resin storage and newly pro- duced resin are essential to understand the changes in resin-based defences.
To understand the effects of drought on resin-based defences, we studied the carbon allocation to resin and the direct effects of water availability and tree water status on resin flow and resin pressure in mature Scots pine (Pinus sylvestris) in the Pfynwald forest in Valais, Switzerland, during the exceptionally hot dry summer in 2018.
Comparing the naturally drought-prone plots and plots that had been irrigated since 2003 allowed us to disentangle the short-term effects of decreasing water availability from June to August from the longer-term effects of water availability and carbon allocation patterns on the resin- based defences. The questions we asked were 1. Is there a difference in allocation of newly fixed carbon to resin between the irrigated and dry trees? 2. Does this difference also manifest in the observed tree-to-tree variation in resin pressure and resin flow? 3. In addition to its effect through carbon allocation, does variation in water availability and tree water status affect the resin pressure and flow during the measurement period from June to August, and does this effect differ between the irrigated and dry trees? 4. Do drought and irrigation shape the daily resin pressure dynamics and their response to temperature, humidity and tree water potential?
Based on the growth-differentiation balance framework, we expected that in comparison to dry conditions, irrigation may increase carbon allocation to growth relatively more than it increases carbon assimila- tion, thus reducing carbon available to resin production. We further hypothesised that the reduced allocation to resin would manifest as decreased resin flow and resin pressure at a given water availability. In addition, we hypothesised that the resin pressures would decrease with drought from June to August, but the effect of tree water potential on resin pressure dynamics would be less important in irrigated trees than in dry control trees. Conversely, we expected the effect of temperature to be more important in irrigated trees than in dry control trees.
2. Materials and methods 2.1. Measurement site
The study site, Pfynwald, is located on an alluvial fan and debris cone in a dry interalpine valley in Canton Valais, Switzerland, at an elevation of 615 m a.s.l. Pfynwald is a part of the Swiss Long-term Forest Ecosystem Research Programme LWF (www.lwf.ch). Naturally regen- erated Scots pines approximately 100 yr old and predominantly 11 m tall are the dominant trees of the forest, with an undergrowth of sessile and downy oak (Quercus petraea (Matt.) Liebl., Q. pubescens Willd.),
downy birch (Betula pubescens Ehrh.) and common whitebeam (Sorbus aria (L.) Crantz). The stand density is approximately 730 trees per ha (Dobbertin et al., 2010) and the soil is a shallow Pararendzina (Brunner et al., 2009). No logging has been done in the part of the forest where we operated. The annual mean temperature is 10.1 ◦C, the mean tempera- ture of the warmest month (July) 20.1 ◦C and of the coldest month (January) -0.1 ◦C, measured at the nearby long-term weather station (Sion, 20 km distance from the experimental site, MeteoSwiss, period 1981–2010). Over the measurement period from July to August 2018, the mean temperature was 21.1 ◦C. The annual precipitation at the site is approximately 600 mm, generally evenly distributed through the year with approximately 350 mm of precipitation over the growing season (April-October) (Federal Office of Meteorology and Climatology MeteoSwiss). Over April-October 2018, the recorded precipitation was approximately 258 mm. Recently, the forest has experienced drought and heat-induced forest mortality (Rigling et al., 2013).
2.1.1. The irrigation experiment set-up
The forest hosts a long-term irrigation experiment comprised of four 1000-m2 plots that serve as untreated dry control plots and four similar irrigated plots. The irrigated plots have been irrigated since 2003 with an additional 600 mm yr−1 of water during the growing season (April–October). The irrigation happened at night-time, using sprinklers and water from a nearby channel. In 2018, the irrigation yielded a total precipitation of 258 mm +600 mm =858 mm on the irrigated plots over April-October. For detailed description of the experiment set-up, see Dobbertin et al. (2010) and Herzog et al. (2014).
2.2. 13C pulse labelling
In late August 2017, in total ten trees – five trees on three dry control plots and five trees on three irrigated plots – were labelled once with
13CO2. One dry control tree and one irrigated tree were labelled simul- taneously in one day (morning-mid-day), and there were in total five labelling days. First, transparent plastic chambers (polyethylene, 220 g m−2) were erected from scaffolds enclosing the entire crown of the trees.
Temperature and relative humidity (RH) within the chambers were kept at ambient levels, using a mobile air-conditioning system (see Fig. S1 for the set-up scheme and Fig. S2 for the weather conditions during the pulse labelling). After sealing the chamber, over a period of 3.5 h we continuously added approximately 10 g of CO2 with >99 atom% 13C (Cambridge Isotope Laboratories Inc., Tewksbury, MA, USA) into the chamber using mass-flow controllers. We kept the 13CO2 concentration during the whole labelling between 1000 and 1500 ppm, yielding a δ13C up to 250 000 (‰) (compare to approximately -28‰ which was the baseline enrichment in resin of non-labelled trees, see Fig. 1). The enrichment in the chamber air was measured with an isotope laser spectrometer (model CCIA-46 d, Los Gatos Research Inc. (now ABB-Los Gatos Research Inc.), San Jose, CA, USA). Afterwards, the chambers were removed, and large industrial blowers set up on the forest floor removed the non-assimilated 13CO2. The CO2 uptake and 13CO2
enrichment in the respiration and tissue of several tree parts were measured in a parallel study, see for details Joseph et al. (2020).
2.2.1. Resin sampling
During each labelling day and the following days, we collected resin from the labelled trees, as well as from one non-labelled dry control tree and one non-labelled irrigated tree that served as reference trees. We repeated the resin collection from each of these 12 trees exactly on day 8, and approximately on days 55, 271 and 355 after the labelling. Using a subset of 8 trees, we also sampled resin before the labelling (day 0), and on days 2 and 5 after the labelling. To collect the resin, we drilled each day a 6-mm-wide and approximately 5-cm-deep hole upwards through the bark into the xylem, on the north side of the stem and approximately at breast height. Each new hole was always at least 10 cm away from the earlier holes. Then, we pushed a 6-mm-wide and
approximately 3-cm-long plastic (polytetrafluoroethylene) tube piece into the hole, secured it to the stem with silicone and attached a 10-ml pre-weighed glass vial to the end of the tube. Although we wounded the xylem, no xylem sap appeared in the vials. We collected the vials 24 h (±1 h) after the installation, weighed them to record the quantity of resin flow and stored them in a freezer until analysis.
From each resin sample, we weighed three 1-mg (±0.2 mg) analyt- ical subsamples of resin in tin capsules for analysis in a Thermo Flash 2000 elemental analyser coupled to a Thermo Finnigan Delta Plus XP isotope-ratio mass spectrometer (IRMS) via a Conflo IV interface (Thermo Finnigan (now Thermo Fisher Scientific), Bremen, Germany).
The stable isotope values were given on the δ scale referenced to the international standard Vienna Pee Dee Belemnite VPDB. We did not dry the resin samples, so they included both the non-volatile part composed of resin acids and the volatile part composed of monoterpenes and ses- quiterpenes. However, due to the volatility of the latter compounds, some losses in them potentially occurred. We used the average over the samples of the non-labelled reference trees as the site-specific baseline enrichment values of resin.
The labelled trees were also sampled several times for phloem, xylem, twigs and roots in a parallel study (Joseph et al., 2020). These repeated samplings may have affected the quantity of extractable resin Fig. 1. Mean δ13C of the resin samples of five Scots pines in dry control plots (orange triangles) and five Scots pines in irrigated plots (blue dots) measured after the 13CO2 labelling of the whole tree canopy. Error bars present one standard deviation of mean. (a) Days 0–8 since the labelling and (b) 0–355 days since the labelling. The solid lines are approximate presentations of the smoothers for temporal variation in the GAM model (Table 1) and the shaded areas show their standard errors. The dashed lines present the baseline δ13C signal in resin without labelling (-27.6‰ in non-labelled dry control tree and -28.6‰ in non-labelled irrigated tree). Note the different y-axis scales between the panels. The number of successfully sampled trees (n) on each sampling day given in the table. (For interpretation of the references to colour in this figure legend, the reader is referred to the web version of this article).
of the study trees, and a part of the resin samplings failed due to diffi- culties in repeatedly sampling enough resin from the study trees (see Fig. 1). In total, we collected 47 samples successfully.
2.3. Resin pressure
We measured the stem resin pressure, using in total six pressure transducers (Gems Sensors 3100; Gems Sensors & Controls, Plainville, CT, USA) on one irrigated and one control plot during June, July and August 2018 (later referred to as the measurement period). The instal- lation of pressure transducers was based on the system used by Vit´e et al.
(1961), modified to accommodate continuous logging (Rissanen et al., 2019). We drilled a 3-mm wide, approximately 3-cm deep hole into the xylem and inserted a 3-mm-diameter metal tube approximately halfway into the hole. Then, we filled the hole, tube and the pressure transducer cavity with glycerine and installed the pressure transducer at the end of the tube. To seal the metal tube-wood interface, we used silicone. A data logger (Campbell CR1000; Campbell Scientific Inc., Logan, UT, USA) recorded the resin pressures every 10 s. If the resin pressure dropped below 0.1 MPa during the first 12 h following installation, we consid- ered the installation unsuccessful and did not use the data in further analysis. Based on previous experience (see Rissanen et al., 2019) and to optimise the data acquisition, we reinstalled each transducer after a period of approximately 5–10 days, because the resin either leaked or crystallized in the tube and transducer, reducing the resin pressure recorded and its degree of variation. The reinstallation was always at least 10 cm apart from the previous installation wounds. Resin pressure usually dropped considerably 2–4 days after the pressure transducer installation and the resin pressure dynamics weakened, thus we focused our analysis on the first 3 days following the pressure transducer installation.
We divided the six pressure transducers for repeated measurements on the same trees and for short-term measurements that switched from tree to tree. This way, we gained understanding both on the trends of resin pressure over the measurement period and on the tree-to-tree variation of the resin pressure. The choice of study trees was con- strained by their distance from the central logging system, and we dis- carded any trees with visible damage such as wounds. For example, we did not use the trees that were 13CO2 labelled in August 2017. When choosing the trees that were measured repeatedly, we preferred trees of which the stem and canopies could be accessed from measurement scaffolds. With these criteria, we chose for repeated measurements three trees in the irrigated plots (trees 1–3) and three trees in the dry control plot (trees 4–6) (Figs. S3, 2 a,b). We used one pressure transducer to measure tree 1 and one pressure transducer to measure tree 4 through the whole measurement period, one pressure transducer to switch be- tween the trees 2 and 3 in two-week turns, and one pressure transducer to switch between the trees 5 and 6 in two-week turns (Figs. S3, 2 a,b).
For the shorter measurements we used two pressure transducers that were both installed to a new tree every two weeks (irrigated trees 7–12 and dry control trees 13–19) (Figs. S3, 2 c,d). The installation location of the transducers was either approximately 3 m (trees 1–6) or 1–2 m (trees 7–19) from the ground.
As we reinstalled the pressure transducers every 5–10 days, we wanted to determine whether the repeated mechanical wounding trig- gered the tree defence reactions and affected the measured resin pres- sures. To test this, we drilled a test hole 3–5 cm from the location where we had installed the pressure transducer 1–2 days before and recorded the resin pressure changes during and after the test drilling. Since we detected no sharp instant or delayed change in resin pressure after the drilling during the five repetitions of this test in different trees (data not shown), we assumed that the drilling itself caused no rapid local Fig. 2.Resin pressure dynamics in Scots pine, soil water potential (SWP) and mid-day twig water potential (TWP) over the measurement summer 2018 in Pfynwald. (a) resin pressure dynamics of repeatedly measured irrigated trees 1–3 and (b) dry control trees 4–6 over 3 days after each installation of pressure trans- ducer; (c) resin pressure dynamics of irrigated trees 7–12 and (d) dry control trees 13–19 over 3 days after each installation of pressure trans- ducer; (e) 3-day mean resin pressures in irri- gated trees and (f) dry control trees, different shades of filled symbols represent each repeat- edly measured tree (trees 1–6), and empty symbols represent trees 7–19 that were each measured for 2 weeks, dashed lines represent smoothed mean resin pressure trends over the trees; (g) soil water potential (SWP) at 80 cm (line) and twig water potential (TWP) (symbols) as a mean over five trees (the error bars repre- senting one standard deviation from the mean) on irrigated plot and (h) control plot. The oc- casional higher values of TWP in relation to SWP may have been due to variability in soil moisture in the rooting zone and the roots tapping soil layers deeper than 80 cm.
response in the resin pressures.
2.4. Resin flow from wounds
We measured the resin flow of a subset of trees on all the plots (four control and four irrigated plots) in June 5–8 and in August 15–16, 2018, using the resin collection method described in section 2.2.1 Resin sam- pling. We collected the resin into pre-weighted vials for 24 h (±1 h) and collected and reweighted the vials to measure the exuded resin (resin flow) in grams per 24 h. We selected for the sampling a subset of 50 trees covering the two treatments and a continuum of tree sizes and crown transparencies. All the selected trees were among 100 trees the resin flow of which had already been measured in 2014 (Simeon, 2015).
Before the selection, we discarded the trees used for the 13CO2 labelling in August 2017 and the trees used to the resin pressure measurements to avoid any effects of recent wounding. To gain a representative subset, we classified the 100 trees into three crown transparency classes (0–25
%, 30–50 % and 55–100 %, the same as used by Simeon, 2015) and ranked them within the class by their diameter at breast height. Then, we selected eight to nine trees from each class evenly along the breast height diameter gradient.
The crown transparency described the state of the crown defoliation, and because of its prevalence in Pfynwald and its links to direct drought effects and insect activity, it was an important variable to include in the tree selection. It is regularly estimated in Pfynwald by trained observers who follow the guidelines of ICP Forests (https://www.icp-forests.org) as a part of the Long-term Forest Ecosystem Research Programme (LWF).
In the assessment, the crown was visually rated from 0 % to 100 % by comparing with reference photographs: 0 % corresponding to a tree of the same species with maximum green foliage and 100 % to a dead tree.
The protocol is described in Dobbertin et al. (2004) with examples of the reference photos.
Some of the resin flow measurements failed because the resin collection vial attachment failed or because the sampling location did not exude enough resin to be quantified. The total number of trees measured successfully in June was 18 in the irrigated plots and 22 in the control plots, and in August 22 both in the irrigated and in the control plots. These trees included trees in all three transparency classes. Oc- casionally, some resin spilled from the collecting vials, due to very strong resin flow, which may have caused a small underestimation of the highest resin flows in approximately 10 samples in control plots and 7 in irrigated plots in June, and 1 sample in both irrigated and dry control plots in August.
In Simeon (2015), the resin samples were collected from the xylem surface, using a wider puncture hole (13 mm) and slightly larger collection vials (15 ml). Otherwise, the sampling method was similar to ours. Thus, our measurements and the 2014 measurements were not comparable one-to-one, but the two methods probably captured the relative differences between the trees in a corresponding way.
2.5. Auxiliary measurements
Auxiliary measurements included continuous measurements of ambient air temperature, relative humidity (RH) and soil-water poten- tial (SWP) along with regular point measurements of water potential from twigs (twig water potential – TWP). These measurements were taken from June to August 2018. The temperature and RH were continuously recorded (Sensirion, St¨afa, Switzerland) in one spot above the canopy of the dry control plot where we measured resin pressures.
Using temperature and RH, we also calculated vapour pressure deficit (VPD). We used the temperature, RH and VPD to explain resin pressure daily dynamics and trends over the measurement period, as well as to characterise the potential differences between the two resin flow mea- surement times.
The SWP measurements described the soil water availability, and the TWP described the water status of the trees. We used them to understand
the differences in water status between the irrigated and dry control trees, to explain the daily variation and trends in resin pressures as well as to characterise the potential differences between the two resin flow measurement times. SWP was recorded continuously at depth of 10 cm and 80 cm (MPS-2; Decagon Devices (now METER Group Inc. USA), Pullmann, WA, USA) at two locations of each plot. We used the SWP measurement at depth of 80 cm and at locations that were closest to the trees measured. We quantified the TWP with point measurements of five irrigated trees and five dry control trees on the same two plots where we measured resin pressures. Before the TWP measurement, we enclosed one twig of each of the ten trees in a shaded plastic bag (commercial freezer bag) for 40–60 min. The bag stopped water loss from needles, which drove the twig water potential to equilibrium with the connected branch xylem and reduced the variation in needle and twig water po- tential due to short-term changes in transpiration (Begg and Turner, 1979; McCutchan and Shackel, 1992). After this time, we collected the twigs and measured their water potentials in a pressure chamber (670, PMS Instrument Company, Albany, OR, USA). The time stamp used for TWP values in further analysis was the time of the twig collection. The TWP measurements took place twice per week over June, July and August 2018: on one day only at midday and on another day four times between 0800 h and 2000 h. In total we measured TWP of the ten trees 46 times in 19 days.
We could not conduct the TWP measurements with all the resin pressure measurement trees, because their canopies were not accessible.
We could, however, make simultaneous measurements of resin pressure and TWP with trees 2, 3 and 5, along with tree 8 that was measured for 2 weeks. With these trees, we were able to analyse the similarities in daily dynamics of resin pressure and TWP. With the other trees (trees 1, 4 and 6, as well as the trees measured for 2 weeks) we only analysed the re- lations of resin pressure and TWP trends using the mid-day TWP as a mean over the five trees measured in each plot.
2.6. Data analysis
We tested the significance of the treatment (dry control or irrigated) on the 13C enrichment in resin of the labelled trees using generalised additive model (GAM, R-package mgcv function gam, Wood, 2017). In the GAM, the treatment was a parametric factor, and to account for the repeated measures on one tree we added tree identity as a random effect (random smooth term). To account for the temporal changes in the enrichment, we added the sampling day (as days since labelling) with a smooth term (k =5) and to enable treatment interaction with sampling day, we let the smoot term to be fitted separately for the two treatments.
We tested the potential dilution effect of resin flow on the 13C enrich- ment by adding the resin flow measured with each sample to the model as a covariate, but it had no significant effect and was not used in further analysis. To evaluate the significance of each effect, we used ANOVA F-test.
To distinguish the long-term treatment effect and shorter-term ef- fects of environmental variables and tree water status on the level of resin pressure over the measurement period, we used linear-mixed effect models (LME; R package lme4 function lmer, Bates et al., 2015). We fitted the LME to the 3-day mean resin pressures using the tree identity as random effect to account for the repeated measurements on one tree.
Treatment and month (June, July or August) as factors and 3-day means of VPD and temperature and TWP (as a mean of mid-day values of the five trees measured on each treatment) as continuous covariates were the tested fixed effects. We also tested the interactions of month, VPD, temperature and TWP with the treatment. Both TWP and SWP could not be included due to their confounding close correlation, and we choose TWP because it described the trees’ internal water status and provided a better fit. We fitted the model first with all the 19 measured trees and then with only the trees 1–6 that were measured repeatedly through the measurement period. To remove the insignificant fixed effects and to establish the final model form, we compared the Akaike information
criterion (AIC) between nested models where one effect was removed at a time. We analysed the significance of each fixed effect in the final model with ANOVA type III with Wald test.
In addition, we analysed whether the responses of resin pressure to temperature and other environmental variables diverged between the treatments in a daily scale. In this analysis, we only included the repeatedly measured trees 1–6 because of their long time series. Before the analysis, we removed from the 3-day periods any zero or below-zero values that may have been caused by resin crystallization and weakened signals. We used LME to explain the daily resin pressure patterns over the period of 3 days after installation of the pressure transducer. The interaction of tree identity and the first measurement day of the 3-day period (as an installation time identifier) was the random effect.
Treatment (dry control or irrigation) as factor and RH, temperature and SWP as continuous covariates were the tested fixed effects, along with the interactions of RH, temperature and SWP with the treatment. We could not use TWP in the model, due to too small frequency of the measurements (max 4 measurements per day). However, we deemed important to add SWP into the model because of the potentially influ- ential diurnal pattern of SWP that was created by the night-time irri- gation in the irrigated plot (see Fig. 4a). Again, we used the Akaike information criterion (AIC) between nested models to select the final model variables and ANOVA type III with Wald test to analyse the sig- nificance of each effect in the final model.
We also tested bivariate correlations between the 3-day mean resin pressure and SWP, mid-day TWP, temperature and VPD as well as be- tween the hourly values of resin pressure and the corresponding TWP measured from the same tree. To calculate the correlations over the different repeatedly measured trees, we used repeated measures corre- lation (R-package rmcorr function rmcorr, Bakdash and Marusich, 2017).
To study the treatment effect on resin flow we had to account for the other potential causes of tree-to-tree variation. Thus, we used linear models including the treatment, crown transparency and resin flow measured from the same tree in 2014 (Simeon, 2015) to explain resin flow separately in June and August. We added the resin flow in 2014 to the model to explain the inherent tree-to-tree variation in the resin flow that is not explained by environmental factors or tree acclimation but is probably more tied to the tree genotype (Mergen et al., 1955; Hanover, 1975). Because resin flow in 2014 did not differ between the irrigated and dry control trees (Simeon, 2015), it did not risk reducing the treatment effect in the models. We also tested the effects of other stand and tree variables such as tree diameter at breast height, radial growth over the previous 9 yr, SWP or the subplot number as a factor, but these were not significant so they were not considered further. Before applying the model, we used square-root transformation in both the 2018 and 2014 resin flow data to obtain normal distribution of the model residuals. We used the AIC to select the final model variables. For the calculations and statistical analysis, we used Matlab version R2017b (The Mathworks Inc., Natick, MA, USA) and Rstudio version 1.2.1335 (RStudio PBC, Boston, MA, USA).
3. Results
3.1. Labelled carbon allocation to resin
The first three labelling days followed a dry period of late August 2017, but a light rain fell before the two last labelling days (Fig. S2). The daily mean temperature during the labelling days varied between 21 ◦C and 22 ◦C before the rain event and 13 ◦C and 19 ◦C after the rain event, and soil water content at 80 cm depth remained approximately at 40 % on irrigated plots and 20 % on dry control plots (Joseph et al., 2020;
Zweifel et al., 2020, Fig. S2).
The labelling experiment showed a clear increase in newly assimi- lated (i.e. 13CO2-labelled) carbon in the resin of both the irrigated and dry control trees between the fifth and eighth day after the labelling
(Fig. 1a). We measured the highest enrichments of 13C in resin samples on day 54 after the labelling and the enrichment persisted in the resin until summer 2018 (days 271 and 355) (Fig. 1b). The difference in resin enrichment between treatments was marginally significant over all the sampling days (F =3.809, p =0.060) (Table 1). The interaction between the treatment and the temporal smoother was significant (F =4.536, p <0.01), revealing the considerably stronger response of the dry con- trol tree resin to labelling in comparison to the irrigated tree resin (Fig. 1b).
3.2. Resin pressure
SWP, TWP (Fig. 2g,h) and resin pressure (Fig. 2a–f) generally decreased over the measurement period from June to August both in dry control plot and irrigated plot. The drop in SWP and TWP (Fig. 2h) and resin pressure (Fig. 2f) occurred slightly earlier in dry control plot in comparison to the irrigated plot (Fig. 2e,g). The mean SWP and TWP were higher in irrigated plot over the measurement period (SWP in irrigated plot -0.8 MPa and in dry control plot -1.4 MPa, df =1, F =231 872, p <0.001; mid-day TWP in irrigated plot -1.4 MPa and in dry control plot -1.6 MPa, df =1, F =14.7, p <0.001). Daily mean ambient temperature varied approximately from 15 to 27 ◦C over the measure- ment period, and RH from 55 to 95 % (Fig. S4). We recorded only two important precipitation events during the measurement period (Fig. S4).
The LME showed that the mean resin pressure was higher in the dry control trees than in irrigated trees when we accounted for the effect of TWP difference between the treatments (irrigation effect -0.31 or -0.26 (MPa), Table 2). This effect significantly improved model fit according to AIC but was only marginally significant in ANOVA Wald test (Table 2). The interaction between the treatment and TWP was signifi- cant in ANOVA : the short-term effect of the TWP on the resin pressure was stronger in the dry control trees (0.204 and 0.206 MPa MPa−1, Table 2) in comparison to the very small and negative effect in the irrigated trees (-0.024 and -0.007 MPa MPa−1, Table 2). The significance of month as a factor indicated the presence of some seasonal dynamics not explained by the TWP changes (Table 2). Temperature, VPD or interaction between month and treatment were not significant in the final models, and the residual patterns of the models did not display distinct trends (Fig. S5).
The LMEs also highlighted the tree-to-tree variation in resin pressure even within a treatment, with an important contribution of the random effect on the complete model R2 (Table 2). Within the dry control trees, some of the tree-to-tree variation could be explained by crown trans- parency (r=-0.67 p <0.05 n =10), but within the irrigated trees or over all the trees, this relation was not significant (irrigated trees r=-0.27 p =0.47 n =9, all trees r =0.40 p =0.09 n =19) (Fig. S6).
Reflecting the LME results, we observed positive correlations be- tween the 3-day mean resin pressures and TWP (r =0.72, p <0.001, n =18, Fig. 3d) as well as SWP (r =0.47, p <0.05, n =25, Fig. 3b) over the dry control trees. Over the irrigated trees, the correlations were positive but not significant (TWP r =0.11, p =0.63, n =20 Fig. 3c, SWP r =0.31, p =0.10, n =27, Fig. 3a). Temperature and VPD did not have significant correlations with the 3-day mean resin pressures except for Table 1
ANOVA F-test for the GAM model explaining δ13C of the resin samples of labelled trees, including the effect of treatment (ctrl: dry control or irr: irriga- tion), and temporal smoother (s) (for sampling day as days since labelling) in interaction with the treatment and the tree ID with random smoother as random effect. Df for the smooth terms are estimated degrees of freedom (Edf).
Model effects Df / Edf F-value P-value
Treatment 1 3.809 0.060
s(Sampling day: ctrl) 3.17 19.88 <0.001
s(Sampling day: irr) 2.78 3.846 0.023
Tree ID
(random effect) 7.15 8.915 <0.001
the negative correlation between temperature and 3-day resin pressure in dry control trees (r=-0.47, p <0.05, n =25).
Despite the diverging resin pressure trends over the measurement period, the daily dynamics of resin pressure were generally similar be- tween the irrigated and dry control trees (an example of daily dynamics in Fig. 4). During approximately 2–4 d after each pressure transducer installation, the lowest resin pressures occurred in the afternoon and the highest at dawn, occasionally exceeding the 1-MPa upper detection limit of the pressure transducers (Fig. 4). The resin pressures began to
decrease rapidly after 2–4 d, and the daily dynamics dampened considerably (Fig. 4b, see June 22).
Interestingly, the temperature effect on daily resin pressure dy- namics was positive in the LME despite the contrasting daily patterns of temperature and resin pressure (Fig. 4). The effects of temperature, RH and SWP on resin pressure daily dynamics were significant and more pronounced in irrigated trees versus dry control trees (temperature ef- fect 0.016 vs. 0.007 MPa C−1, RH effect 0.008 vs. 0.004 MPa %-1 and SWP effect 0.72 vs. 0.56 MPa MPa−1, Table 3). The treatment effect was Table 2
The final forms mixed-effect models (LME) explaining the 3-day mean Scots pine stem resin pressures after installation of the pressure transducer in irrigated and dry control trees in summer 2018. Model R2, fixed effect significances by Anova type III Wald test and parameter estimates for the fixed effects.
All trees 1-19, n=56
(17 trees, n=56) Trees 1-6, n=51
(6 trees, n=38)
R2c R2m R2c R2m
0.67 0.21 0.67 0.51
ANOVA test Chisq Df P-value Chisq Df P-value
(Random intercept) 21.21 1 <0.001 24.95 1 <0.001
Treatment 3.319 1 0.069 3.372 1 0.066
Month 6.998 2 0.030 13.88 2 <0.001
TWP:treatment 8.085 2 0.018 11.26 2 0.004
Parameter estimates for fixed effects Esrtimate SE Estimate SE
Intercept
(Control, June) 0.557 0.121 0.514 0.103
Treatment Control 0 0
Irrigation −0.312 0.171 −0.263 0.143
Month June 0 0
July 0.031 0.048 0.013 0.040
August −0.062 0.042 −0.089 0.035
TWP: control 0.204 0.077 0.206 0.065
TWP: irrigation −0.024 0.100 −0.007 0.085
Only effects that improved model fitting according to Akaike information criteria (AIC) were included in the final model). n: total number of observations used in the model, R2c: complete model R2, R2m: marginal R2 including only fixed effects, SE: standard error, TWP: twig-water potential (MPa).
Fig. 3.Relations between 3-day mean resin pressure after pressure transducer installation and soil water potential (SWP) in (a) irrigated trees (n =27) and (b) dry control trees (n =25), and between 3-day mean resin pres- sure and mid-day twig water potential (TWP) as a mean over five measured trees per plot in (c) irrigated (n =20) and (d) dry control trees (n =18). Different shades of filled symbols and dotted lines represent each a repeatedly measured tree (trees 1–6), open symbols represent the trees 7–19 that were measured each for 2 weeks. Significant correlations (p <0.05) over all the trees of treatment are represented with grey dashed lines and the correlation coefficient of repeated measures correlation. Note different x-axis between irri- gated and control trees.
also significant, estimating 0.53 MPa higher resin pressure in dry control in comparison to irrigated trees (Table 3).
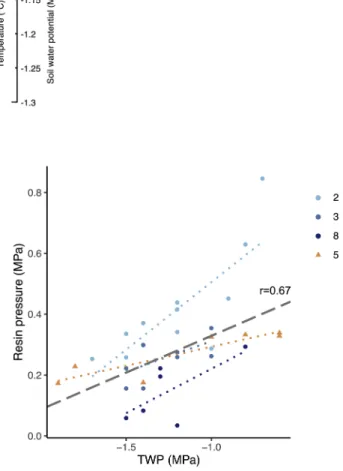
The daily patterns of resin pressure were also related to the TWP daily dynamics, their correlation over the analysed trees being 0.67 (p <0.001, n =28) (Fig. 5). The correlation was significant also when considering only the irrigated trees (r =0.74, p <0.001, n =22), but the lack of dry control trees with simultaneous resin pressure and TWP measurements prevented from assessing the correlation among them.
3.3. Resin flow
The linear models explaining tree-to-tree variation in resin flow in June showed that the resin flow was significantly lower from the irri- gated than from the dry control trees (Table 4, 2.82 - (2.8 - 0.5)2 =2.6 (g per 24 h)). In August however, the treatment effect was not significant.
The models also showed that the resin flow both in irrigated and dry control plots was negatively associated with crown transparency and Fig. 4.An example of daily dynamics of resin pressure (col- oured solid line) in Scots pine stem, ambient air temperature (T, solid black), ambient relative humidity (RH, dashed black) and soil water potential (SWP, black points) of (a) irrigated tree (Tree 2, blue) and (b) dry control tree (Tree 4, orange) in drought-prone Pfynwald, in June 2018. Note the different scales of the soil water potential axis between panels, and the daily variation in soil water potential on irrigated subplot caused by the irrigation at nights. (For interpretation of the references to colour in this figure legend, the reader is referred to the web version of this article).
Table 3
The final forms mixed-effect models (LME) explaining Scots pine stem resin pressure variation over 3 days after installation of the pressure transducer for the trees 1–6 that were repeatedly measured throughout the summer of 2018 in the irrigated and dry control plots. Model n, R2, fixed effect significances by Anova type III Wald test and parameter estimates for the fixed effects.
n R2c R2m
159 532 0.78 0.48
ANOVA test Chisq Df P-value
(Random intercept) 128.3 1 <0.001
Treatment 60.56 1 <0.001
RH:Treatment 4 892 2 <0.001
T:Treatment 1 917 2 <0.001
SWP:Treatment 2 162 2 <0.001
Parameter estimates for fixed effects Estimate SE
Intercept (Control) 0.517 0.045
Treatment Control 0
Irrigation − 0.526 0.068
RH:control 0.004 0.0001
RH:irrigation 0.008 0.0001
T:control 0.007 0.0003
T:irrigation 0.016 0.0004
SWP:control 0.558 0.014
SWP:irrigation 0.723 0.027
Only effects that improved model fitting according to Akaike information criteria (AIC) were included in the final model n: total number of observations used in the model, R2c: complete model R2, R2m: marginal R2 including only fixed effects, SE: standard error, RH: ambient relative humidity (%), T: ambient air temperature (◦C), SWP: soil-water potential (MPa).
Fig. 5.Relations between single measurement points of twig water potential (TWP) and resin pressures measured from the same tree. Including only trees where both twig water potential and resin pressure were successfully measured:
three irrigated Scots pines (repeatedly measured trees 2, 3 and tree 8 that was only measured for 2 weeks in June, blue dots) and a dry control Scots pine (repeatedly measured tree 5, orange triangles). The dotted lines represent the least-square lines for each tree separately. The grey dashed line and the cor- relation coefficient the represents significant (p <0.05) repeated measures correlation over all the trees. n =28. (For interpretation of the references to colour in this figure legend, the reader is referred to the web version of this article).
positively with the resin flow in 2014 (Table 4, Fig. 6). The negative relation between crown transparency and resin flow was stronger in June (-0.03 g %−1) than in August (-0.02 g %−1) (Table 4, Fig. 6a). On the contrary, the positive relation between 2018 and 2014 resin flows was stronger in late summer when the sampling was done in August both in 2014 and 2018 (Table 4, Fig. 6b). The early summer sampling was done in April in 2014 and in June in 2018, and the relation between them was weaker (Table 4, Fig. 6b).
The models explained approximately one third of the tree-to-tree variation with an R2 of 0.36 in June and 0.32 in August (Table 4), but model fits and residual patterns did not indicate trends or strong biasing effects of the external variables (Fig. S7). The variation in the model residuals between the subplots (replicates) of both treatments indicated a potential unaccounted-for difference in dry control subplot 8 in com- parison to other subplots in June (Fig. S8).
Due to the sampling scheme for choosing the trees for resin flow measurements, the crown transparency within this tree group did not differ between the irrigated and dry control trees. In addition, the resin flow in 2014 did not differ significantly between the treatments in this tree group, reflecting the results of Simeon (2015). Despite the large decrease in SWP between June and August (from − 70 kPa to − 570 kPa in the irrigated plots and from − 680 kPa to − 1680 kPa in the dry control plots), we did not observe significant reductions in resin flow between the sampling dates (mean resin flow in June 5.03 g in 24 h, mean resin flow in August 5.37 g in 24 h, F =0.0009, p =0.98, df =1).
4. Discussion
We found that in contrast to added irrigation, long-term drought supported carbon allocation to resin production in a naturally drought- prone Scots pine forest. It also affected resin pressure and resin flow levels and resin pressure dynamics during the exceptionally dry summer of 2018. Along with the treatment (irrigation or dry control) effect, the SWP and TWP were the most important factors explaining the resin pressure trends over the measurement period, and crown transparency and resin flow measured in 2014 explaining the resin flow variation between the trees.
4.1. Long-term drought and irrigation effects
The irrigated trees in Pfynwald have experienced increases in both photosynthesis and growth since the start of the experiment (Herzog et al., 2014; Timofeeva et al., 2017; Sch¨onbeck et al., 2018). We ex- pected that carbon allocation to previously restricted growth increased more in relation to photosynthesis and reduced the resource allocation to resin production, based on the growth-differentiation framework (Lorio, 1986; Herms and Mattson, 1992; Lerdau et al., 1994). The
13CO2-pulse labelling showed that the resin of the dry control trees became considerably more enriched than the resin of the irrigated trees, suggesting that the allocation of newly assimilated carbon to resin was indeed higher in the dry control trees. Differing resin flows and label dilution did not affect the differences in resin enrichment. The trees labelled in this experiment also experienced other sampling and me- chanical wounding, potentially provoking stress and enhancing resin production. However, since the sampling intensity was similar between the treatments, this should likewise not have affected the difference between treatments.
Both in the irrigated and dry control trees, the newly assimilated carbon reached the stem resin in approximately 5–8 days, which is similar to the time scale for transport of sugars in the phloem from the canopy to the stem base at this site (Joseph et al., 2020) and in pine of similar size in general (Epron et al., 2012). The resin production from labelled carbon continued up to 2 months from the labelling, and the enrichment was still considerable approximately 1 year after the label- ling. Thus, although the appearance of the label in the resin was rela- tively rapid, the total turnover of the carbon reserves used for resin Table 4
Coefficients of the final linear models explaining square-root-transformed resin flow from Scots pine stems in the irrigated and dry control plots in June and August 2018.
Estimate SE t-value p-value
June, n =47, df =34, R2 =0.36
Intercept (Control) 2.816 0.430 6.54 <0.001
Treatment Control 0
Irrigation −0.513 0.259 −1.98 0.056
CT −0.030 0.008 −3.89 <0.001
RF 2014 0.616 0.340 1.81 0.08
August, n =47, df =38, R2 =0.32
Intercept 1.833 0.481 3.82 <0.001
CT −0.023 0.009 −2.53 0.016
RF 2014 0.833 0.264 3.15 0.003
The final model parameters were chosen and significant based on the Akaike information criterion (AIC). SE: standard error, n: number of trees, df: model degrees of freedom, CT: crown transparency (%), RF 2014: resin flow measured from the same trees in summer 2014 (g per 24 h, square-root-transformed).
Fig. 6. Resin flow from wounds related to (a) crown transparency of irrigated (blue dots) and dry control (orange triangles) Scots pine trees in Pfynwald in June (filled symbols, n =38) and August (open symbols, n =42) 2018; and (b) to resin flow measured from the same trees in April (n =36) and August (n =39) 2014. The solid lines represent the least-square line of measurements in June and the dashed lines measurements in August. Corresponding Pearson’s correlations are shown without parentheses if significant (p <0.05) and in parenthesis if not significant. Note: resin flows in 2014 and 2018 were not measured with the exact same method, hence the difference in absolute values, see section 2.4 Resin flow from wounds. (For interpretation of the references to colour in this figure legend, the reader is referred to the web version of this article).
production or the turnover of the resin pool itself was slow, as suggested by Wilson et al. (1963) and Gershenzon et al. (1993).
The allocation and use of newly fixed versus stored carbon to resin production may differ between the production of constitutive resin and an induced defence reaction. Gu´erard et al. (2007) found that in Scots pine seedlings that had been labelled with 13CO2 approximately one month before an inoculation treatment, the inoculation-induced resinous sapwood was more 13C enriched than other tissues. The au- thors concluded that the induced defence reactions used stored carbon rather than newly fixed carbon. Similarly, L´opez-Goldar et al. (2016) found that induced defences against a bark-chewing herbivore do not necessarily need newly assimilated carbon, but lack of light and new carbon assimilation have also been found to restrict the defence reaction in a similar situation (Su´arez-Vidal et al., 2017). The strong allocation of stored carbon to induced resin defences may also contribute to the carbohydrate storage depletion of host trees during a severe attack by bark beetles (Roth et al., 2018).
The diverging allocation of newly assimilated carbon to resin pro- duction between our irrigated and dry control trees was also reflected in the resin pressures and resin flows. The models explaining the resin pressure trends over the measurement period indicated that at a given TWP, resin pressure in the dry control trees was on average 0.26–0.31 MPa higher than in the irrigated trees. Similarly, the dry control trees showed on average higher resin flow than irrigated trees in June 2018. The treatment effect on the mean resin pressure and resin flow could potentially be larger if the photosynthesis and carbon assimilation of the dry control trees were less restricted.
Together, these results suggest that in comparison to irrigated con- ditions, drought has led to stronger allocation of newly assimilated carbon to resin production, maintaining higher level of resin flow and pressure than under irrigated conditions. A similar tendency was re- ported in the resin duct production in another Scots pine forest of the same area: in comparison to drought-prone control trees, resin duct density in the irrigated trees was lower, and cessation of the irrigation provoked an increase in resin duct formation (Rigling et al., 2003).
These results are corroborated by the finding that under drought con- ditions, more 13C labelled recent assimilates were retained aboveground in the control trees (where they might be available for resin production), whereas in irrigated trees allocation to roots and rhizosphere was higher (Joseph et al., 2020). Whether the assimilate allocation to resin pro- duction in our study was a passive overflow of carbon from growth and other primary functions or a result of active regulation, as suggested in the case of carbon allocation to storage (von Arx et al., 2017; Schonbeck ¨ et al., 2018), could not be concluded based on our results.
Although the dry conditions appeared to favour allocation to defence and thus maintain tree resistance against insect pests and other biotic stresses in the long term, the continuous water deficit also weakens trees. In Pfynwald, the crowns of the dry control trees were on average smaller and more defoliated than those of irrigated trees (Dobbertin et al., 2010; Sch¨onbeck et al., 2018), which negatively affects tree growth and survival (Dobbertin and Brang, 2001; Wermelinger et al., 2008, 2018). The crown transparency of trees played an important role in explaining the tree-to-tree variation in resin flow, with smaller resin flow in trees with high canopy transparency than in trees with full crowns both in irrigated and dry control plots. In dry control trees, the mean resin pressure also seemed dependent on the crown transparency.
Similar findings were reported by Annila et al. (1999), Strom et al.
(2002) and Simeon (2015). Thus, despite the potential larger carbon allocation to defence in the dry control trees, the dry trees might be on average more susceptible to secondary stresses due to long-term weak- ening and defoliation. The reduced allocation to resin in the irrigated trees may, however, counteract the otherwise increased vitality.
4.2. Trends in resin pressure and flow over the measurement period Despite the positive effect of dry conditions on the resin-based
defences in the long term, we observed that in the short term, over the measurement period from June to August 2018, resin pressures gener- ally decreased with decreasing TWP and SWP. Previously, a positive effect of water availability and water potential on the resin pressure trends has been reported not only under dry conditions (Vit´e, 1961;
Lorio and Hodges, 1968), but also under moist conditions (Rissanen et al., 2019). In our results, the SWP and TWP effects were stronger in dry control trees than in irrigated trees and the resin pressures of irri- gated trees seemed to decrease only after one month of continuous dry conditions. These results suggest that in a short time scale such as that of a seasonal drought, the direct effects of tree water status are more important in regulating the resin pressure dynamics than the effects of potential changes in carbon allocation patterns. Some of the resin pressure variations may also have been affected by other factors, such as biotic stressors that we did not perceive.
In contrast to previous reports on resin flow changes over the growing season (Lombardero et al., 2000; Gaylord et al., 2007; Rodri- guez-García et al., 2015; Zas et al., 2020), we observed no clear changes in resin flow between June and August. The temperature was similar between the sampling dates in June and August, which may partly explain the unchanged resin flows - the seasonal variations in resin flow have often been explained by temperature variations (Blanche et al., 1992; Gaylord et al., 2007; Knebel et al., 2008; Neis et al., 2018; Zas et al., 2020). In our measurements, the resin flow seemed to be little affected by the large changes in SWP between the sampling dates, which contrasts the findings on resin flow dependencies on short-term water availability that can either increase (Blanche et al., 1992; Lombardero et al., 2000; Zas et al., 2020) or decrease resin flow (Lorio and Hodges, 1977; Dunn and Lorio, 1993; Gaylord et al., 2013).
4.3. Daily resin pressure dynamics
The daily dynamics of resin pressure followed the daily patterns of RH and TWP both in the irrigated and dry control trees. In dry envi- ronments, the daily resin pressure dynamics that follow RH and TWP are hypothesised to result from daily changes in turgor pressures in the epithelial cells surrounding the resin ducts (Vit´e, 1961) or from the slight shrinkage in xylem tracheids, which increases the intercellular space of the resin duct (Helseth and Brown, 1970; Neher, 1993). In contrast, the daily resin dynamics follow temperature in moist boreal forests, where water is not a limiting factor (Rissanen et al., 2019). These daily dynamics may be explained by the effect of temperature on the thermal expansion of resin and on the changes in solubility of gases in resin (Rissanen et al., 2019).
Based on these previous, divergent results between dry and moist environments, we expected to find on the one hand a stronger humidity effect on the resin pressure dynamics in the dry control trees than in the irrigated trees, and on the other hand a stronger temperature effect on the resin pressure dynamics in the irrigated than in the dry control trees.
As expected, the temperature effect was small in dry control trees, but in irrigated trees it was stronger, 0.016 (MPa ◦C−1, Table 3). This value was similar to a modelled temperature effect, 0.018 (MPa ◦C−1) that was estimated based on thermal expansion and the potential effect of bubble- volume increase caused by the decreasing solubility of gases in resin (Rissanen et al., 2019). However, in a relatively dry environment where the effect of water potential appears to be strong, this temperature effect was not large enough to dominate the daily resin pressure patterns as it does in the more humid, boreal environment (Rissanen et al., 2016). The effects of SWP and RH were also slightly stronger in irrigated than in dry control trees, contrasting to model explaining resin dynamics over the whole measurement period. The stronger SWP effect is potentially connected to the nocturnal irrigation that caused distinct diurnal dy- namics of SWP in the irrigated plot. Despite these different effects be- tween the treatments, the differences in daily dynamics of resin pressure between the treatments were small overall.
The abrupt decrease and dampening of the pressure signal 2–4 days