Research Collection
Review Article
Landslide failures detection and mapping using Synthetic Aperture Radar: Past, present and future
Author(s):
Mondini, Alessandro C.; Guzzetti, Fausto; Chang, Kang-Tsung; Monserrat, Oriol; Martha, Tapas R.;
Manconi, Andrea Publication Date:
2021-05
Permanent Link:
https://doi.org/10.3929/ethz-b-000474397
Originally published in:
Earth-Science Reviews 216, http://doi.org/10.1016/j.earscirev.2021.103574
Rights / License:
Creative Commons Attribution-NonCommercial-NoDerivatives 4.0 International
This page was generated automatically upon download from the ETH Zurich Research Collection. For more
information please consult the Terms of use.
Earth-Science Reviews 216 (2021) 103574
Available online 1 March 2021
0012-8252/© 2021 The Author(s). Published by Elsevier B.V. This is an open access article under the CC BY-NC-ND license
(http://creativecommons.org/licenses/by-nc-nd/4.0/).
Landslide failures detection and mapping using Synthetic Aperture Radar:
Past, present and future
Alessandro Cesare Mondini
a,*, Fausto Guzzetti
b,a, Kang-Tsung Chang
c, Oriol Monserrat
d, Tapas Ranjan Martha
e, Andrea Manconi
f,gaConsiglio Nazionale delle Ricerche, Istituto di Ricerca per la Protezione Idrogeologica, via Madonna Alta 126, I-06128 Perugia, Italy
bPresidenza del Consiglio dei Ministri, Dipartimento della Protezione Civile, via Vitorchiano 2-4, I-00189 Rome, Italy
cNational Taiwan University, Department of Geography, No. 1, Section 4, Roosevelt Rd, Da’an District, Taipei City 106, Taiwan
dCentre Technologic de Telecomunicacions de Catalunya, Castelldefels, Barcelona, Spain
eNational Remote Sensing Centre, Indian Space Research Organisation, Hyderabad 500037, India
fEidgen¨ossische Technische Hochschule Zürich, Department of Earth Sciences, Sonneggstrasse 5, 8092 Zürich, Switzerland
gGamma Remote Sensing AG, Worbstrasse 225, 3073 Gümligen, Switzerland
A R T I C L E I N F O Keywords:
Landslide SAR Detection Mapping Inventory Amplitude Phase Coherence DInSAR Modelling
A B S T R A C T
Landslides are geomorphological processes that shape the landscapes of all continents, dismantling mountains and contributing sediments to the river networks. Caused by geophysical and meteorological triggers, including intense or prolonged rainfall, seismic shaking, volcanic activity, and rapid snow melting, landslides pose a serious threat to people, property, and the environment in many areas. Given their abundance and relevance, investigators have long experimented with techniques and tools for landslide detection and mapping using primarily aerial and satellite optical imagery interpreted visually, or processed by semi-automatic or automatic procedures or algorithms. Optical (passive) sensors have known limitations due to their inability to capture Earth surface images through the clouds and to work in the absence of daylight. The alternatives are active, “all- weather” and “day-and-night”, microwave radar sensors capable of seeing through the clouds and working in presence and absence of daylight. We review the literature on the use of Synthetic Aperture Radar (SAR) imagery to detect and map landslide failures – i.e., the single most significant movement episodes in the history of a landslide – and of landslide failure events – i.e., populations of landslides in areas ranging from a few to several thousand square kilometres caused by a single trigger. We examine 54 articles published in representative journals presenting 147 case studies in 32 nations, in all continents, except Antarctica. Analysis of the geographical location of 70 study areas shows that SAR imagery was used to detect and map landslides in most morphological, geological, seismic, meteorological, climate, and land cover settings. The time history of the case studies reveals the increasing interest of the investigators in the use of SAR imagery for landslide detection and mapping, with less than one article per year from 1995 to 2011, rising to about 5 articles per year between 2012 and 2020, and an average period of about 4.2 years between the launch of a satellite and the publication of an article using imagery taken by the satellite. To detect and map landslides, investigators use a common framework that exploits the phase and the amplitude of the electromagnetic return signal recorded in the SAR images, to measure terrain surface properties and their changes. To discriminate landslides from the surrounding stable terrain, a classification of the ground properties is executed by expert visual (heuristic) interpretation, or through numerical (statistical) modelling approaches. Despite undisputed progress over the last 26 years, challenges remain to be faced for the effective use of SAR imagery for landslide detection and mapping. In the article, we examine the theoretical, research, and operational frameworks for the exploitation of SAR images for landslide detection and mapping, and we provide a perspective for future applications considering the existing and the planned SAR satellite missions.
* Corresponding author.
E-mail address: alessandro.mondini@irpi.cnr.it (A.C. Mondini).
Contents lists available at ScienceDirect
Earth-Science Reviews
journal homepage: www.elsevier.com/locate/earscirev
https://doi.org/10.1016/j.earscirev.2021.103574
Received 11 October 2020; Received in revised form 19 February 2021; Accepted 21 February 2021
1. Introduction
In all continents landslides contribute to shape landscapes (Den- smore et al., 1997; Lav´e and Burbank, 2004; Malamud et al., 2004b;
Chang et al., 2014), and in many areas they pose a serious threat to people, properties, and the environment (Brabb and Harrod, 1989;
Dowling and Santi, 2013; Guthrie, 2013; Nadim et al., 2013; Petley, 2012; Badoux et al., 2016; Grahn and Jaldell, 2017; Froude and Petley, 2018; Herrera et al., 2018; Salvati et al., 2018; Rossi et al., 2019). For geological and geomorphological studies, and for landslide hazard and risk assessments, investigators have long experimented techniques, tools, and methods for mapping landslides, in the field or exploiting terrestrial, aerial, and satellite imagery (Guzzetti et al., 2012).
In the last four decades, Earth Observation (EO) imagery – and many related processing and visualisation techniques and tools – have increased significantly the ability to prepare landslide maps (Joyce et al., 2009; Sassa and Canuti, 2009; Guzzetti et al., 2012; Scaioni, 2013;
Casagli et al., 2016). Today, a variety of solutions exist to detect and map landslides applicable in areas of small to very large extent using EO imagery, including the visual interpretation of stereoscopic aerial photography, and the semi-automatic or automatic classification of optical, monoscopic or stereoscopic, imagery taken by space, airborne, drone, or terrestrial platforms (Gokceoglu and Sezer, 2009; Guzzetti et al., 2012; Scaioni, 2013; Scaioni et al., 2014; Casagli et al., 2016, 2017a; Giordan et al., 2018; Zhao and Lu, 2018).
The alternatives to passive (optical) sensors are active sensors. Syn- thetic Aperture Radar (SAR) remote sensing from airborne and satellite platforms exploits active emissions of electromagnetic radiation in the microwave spectral range – between 0.23 GHz (130 cm, P-band) and 40 GHz (0.65 cm, Ka-band) – to illuminate the Earth’s surface. Since active radar sensors do not require illumination from the Sun, and microwaves penetrate the clouds, SAR imagery can – in principle – capture the occurrence (or recurrence) of landslides all day long, even in areas where clouds obstruct optical sensors (European Space Agency, 2020c).
This makes SAR imagery a potentially ideal solution for the detection and mapping of landslides.
In this article, we attempt a systematic, critical review of the litera- ture on the use of airborne and satellite SAR imagery to detect and map landslide failures – where a failure is “the single most significant movement episode in the [...] history of a landslide”, as defined by Hungr et al. (2014) – and landslide failure events i.e., populations of one or many landslides in an area caused by a single trigger (Guzzetti et al., 2012). Similar systematic reviews of the literature on landslide detection and mapping techniques that exploit airborne and satellite, optical (multispectral) imagery, or airborne Lidar terrain data, were completed by e.g., Gokceoglu and Sezer (2009), Guzzetti et al. (2012), Scaioni (2013), Scaioni et al. (2014), Casagli et al. (2017a), and Ray et al.
(2020). Our work complements and updates these reviews. Multi- temporal DInSAR techniques (e.g., Ferretti et al., 2001; Berardino et al., 2002; Lanari et al., 2004; Ferretti et al., 2011) have also been used extensively to detect and measure ground surface displacements caused by slow moving landslides – in the range from mm to cm per year – to update geomorphological and multi-temporal landslide inventory maps (Guzzetti et al., 2012), and to determine and rank the degree of activity (UNESCO Working Party on World Landslide Inventory, 1993) of single or multiple landslides (Bovenga et al., 2006; Farina et al., 2006; Lauknes et al., 2010; Notti et al., 2010; Righini et al., 2012; Bianchini et al., 2012;
Ciampalini et al., 2012; Cigna et al., 2013; Bardi et al., 2014; Raspini et al., 2015; Michoud et al., 2016; Solari et al., 2019; Lu et al., 2019a).
These techniques were reviewed extensively by e.g., Ciampalini et al.
(2015), Casagli et al. (2016), Casagli et al. (2017a), Casagli et al.
(2017b), Solari et al. (2020), and are not covered in our work.
The article is organised as follows. After an explanation of the ter- minology used in the work (Section 2), we describe the construction of the literature database on which we base our review (Section 3). Next, we give a brief description of SAR systems (Section 4). Then we present
the theoretical basis, and the practical use of SAR amplitude (Section 5.1) and phase (Section 5.2) for landslide failure detection and mapping.
This is followed by a critical analysis of the literature (Section 6), and a comparison of different approaches and methods for landslide detection and mapping using SAR imagery (Section 7). Ultimately, we discuss the theoretical, research, and operational frameworks, and we provide a perspective for the future exploitation of SAR imagery for detecting and mapping landslides (Section 8). We conclude (Section 9) by summaris- ing the main lessons learnt.
2. Terminology
The term “landslide” describes the movement of a mass of rock, debris, or earth down a slope (Cruden and Varnes, 1996; Hungr et al., 2014). Landslides are of different types and forms, span multiple orders of magnitude in size and velocity (Cruden and Varnes, 1996; Hungr et al., 2014; Guzzetti et al., 2012), can evolve through multiple move- ment episodes (Leroueil et al., 1996; Hungr et al., 2014), and often happen where they have already occurred, through repetitions, re- currences, and reactivations (Temme et al., 2020). The large variability of the landslides complicates the terminology used to describe the slope failures.
We use the term “landslide” to encompass all types of mass move- ments, and the terms “mass movement” and “slope failure” as synonyms for “landslide”. We use the terms “failure” and “landslide failure” as synonyms, to describe the single most significant movement episode in the history of a landslide (Hungr et al., 2014), and the term “landslide event” to describe a population of landslides, encompassing one to many landslide failures in the same general area caused by a single trigger e.g., an earthquake, a rainfall period, a rapid snowmelt event. To describe the individual landslides, we use the same terms and classification schemes adopted by the authors of the original studies, including terms used to describe the type (e.g., “fall”, “flow”, “slide”, “spread”, “compound”,
“complex” (Cruden and Varnes, 1996; Hungr et al., 2014)) and the rate of movement (UNESCO Working Party on World Landslide Inventory, 1995), the areal extent and volume of the single landslides (e.g., “small”,
“medium”, “large” (Fell, 1994; Hungr et al., 2001; Jakob, 2005)), and the magnitude (numerousness) of the landslide populations (Malamud et al., 2004a). We adopt the same approach to describe the quality (e.g.,
“precision”, “accuracy”, “completeness” (Jackson Jr et al., 2012; San- tangelo et al., 2015)) of the landslide mapping process. We acknowledge that some inconsistency exists in the use of landslide descriptive terms in the literature.
In the article, “landslide detection” (or “detection”) refers to the action of noticing or discovering single or multiple landslide failures in the same general area, and “landslide mapping” (or “mapping) refers to the action of delineating the geometry of a landslide and, where possible, the geometry of the landslide internal features – including e.g., the landslide main boundary, the separation between the source, travel, and deposition areas, fractures, pressure ridges – and to portray the landslide information in map form. Given that to map a landslide the landslide has to be known to the interpreter, “mapping” encompasses
“detection”. We adopt the terminology proposed by Guzzetti et al.
(2012) to classify the different types of landslide inventory maps, separating geomorphological, event, seasonal, and multi-temporal inventories.
A “quantitative” mapping method extracts information on the pres- ence (or absence) of landslides from EO imagery using mathematical, statistical or computational techniques (Given, 2008). Most of these methods exploit machine learning classification techniques, including e.
g., thresholds, logistic regression, random forest, unsupervised clus- tering (Michie et al., 1994; Richards and Jia, 2006). A “qualitative” mapping method obtains information on the presence (or absence) of landslides through an empirical and heuristic visual interpretation of EO imagery – also called “visual investigation”, “visual analysis”, “visual photograph data interpretation”. When applied to map validation, the
terms “qualitative” and “quantitative” refer to methods and techniques that exploit the expert-based recognition of landslides, and mathemat- ical and statistical procedures and associated results, respectively. A
“study area” is a geographical area where a landslide event was inves- tigated. Multiple articles may have investigated the same study area using the same or different approaches. A “case study” is a specific landslide event investigated using a single approach and discussed in a single article.
3. Construction of the literature database
To construct the literature database, we first considered all the relevant articles already known to us. Next, we searched peer-reviewed articles in the Core Collection of the “Web of Science” online platform using keywords and the Boolean search criteria AND, OR, NOT, SAME, NEAR applied to the “title”, “abstract”, and “keywords” of the publica- tions. Keywords we used were “map / mapping”, “detect / detection”,
“recognition”, “identification”, “SAR”, “amplitude”, “intensity”, “back- scatter / backscattering”, “coherence”, and “InSAR / DInSAR”, in com- bination with landslide descriptive terms defined by Cruden and Varnes (1996) and Hungr et al. (2014), including “landslide”, “slope insta- bility”, “landslip”, “rock fall”, “slump”, “slide”, “earth flow”, and “debris flow”. For our search, we included terms like “recognition” and “iden- tification” used in the literature as a synonyms for “detection”.
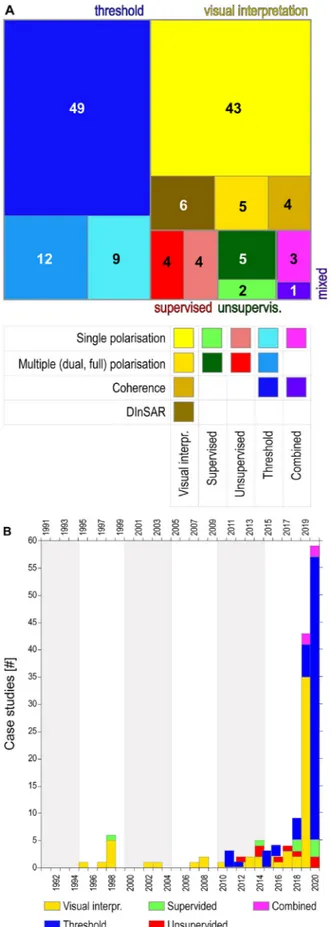
We checked the list of references in all the selected articles, and we repeated the search multiple times from April 2019 to November 2020 to obtain a preliminary list of 126 articles. We examined thoroughly the articles in the preliminary list, and we excluded 72 of them (57%) because they were not relevant, mostly because they dealt with the evolution of single landslides (Hungr et al., 2014). Our final literature database lists 54 articles published between January 1995 and November 2020 in 26 peer-reviewed journals, including 17 remote sensing journals, six earth-science journals, and three multi-disciplinary journals (Fig. 1A). We consider the collection representative of the sci- entific literature on the use of SAR imagery for landslide detection and mapping in the 26-year period 1995–2020. A first conclusion we draw is that, despite the recognised need for landslide maps (Guzzetti et al., 2012), and the alleged capability of SAR imagery to detect and map landslides (Guzzetti et al., 2012; Scaioni et al., 2014; Casagli et al., 2016), the literature on the exploitation of SAR imagery for landslide event detection and mapping remains limited. Inspection of Fig. 1B re- veals a constant increase in the number of published articles per year, with the rate of publications increased first in 2012, and more signifi- cantly from 2018.
To characterise the individual studies in our collection, we searched for information of five categories, namely: (i) the characteristics of the study areas, including the extent of the areas and their geological, geomorphological, land cover, climate, and seismicity settings; (ii) the characteristics of the landslide event, including the number, type, and size of the triggered landslides, and the main landslide trigger (e.g., intense or prolonged rainfall, earthquake); (iii) the image pre-processing approaches; (iv) the image classification methods used in the studies;
and (v) additional ancillary data. This information was not available for all the studies. Two recent papers (Mondini et al., 2019; Burrows et al., 2020) examined multiple case studies, influencing the statistics of the case studies. We found that 70% of the studies provided information on the event landslide trigger, but only 26% gave information on the extent of the study area. Considering the landslides, 28% of the studies reported information on the exact or approximate number of the detected or mapped landslides, 48% gave information on the type, or types of landslides, and only 30% of the studies provided information on the size (area, volume) of the landslides. Overall, we consider the information on the landslide characteristics given in the articles limited, and we recommend to provide more, and more accurate, landslide information when presenting the results of landslide detection and mapping studies.
We also found that 78% of the studies provided information on the
image pre-processing approaches. We attribute this high percentage to the fact that most of the articles (42, 77.7%) were published in remote sensing journals (Fig. 1A). We further found that only 40% of the studies gave information on the land cover type, important for many EO remote sensing applications. Only one article provided information on the geological, morphological, climate, and seismicity settings. Ultimately, we found that 68% of the articles provided information on the validation of the landslide detection and mapping results. The figure is similar to Fig. 1.Articles and journals in the literature database. (A) The 26 journals represented in the literature database. Horizontal bars show number of articles in each journal. Numbers on the side of the bars show the year of publication of the articles. Pie charts show number and percentage of journals and articles in the three journal categories. (B) Temporal distribution of the articles in the literature database. Vertical bars show number of published articles per year (left y-axis). Blue line shows cumulated number of articles per year (right y- axis). Colour shows journal category: pink, remote sensing; green, Earth sci- ences; brown, multi-disciplinary. (For interpretation of the references to colour in this figure legend, the reader is referred to the web version of this article.)
the percentage of statistically-based landslide susceptibility assessment studies that accomplished model validation (Reichenbach et al., 2018).
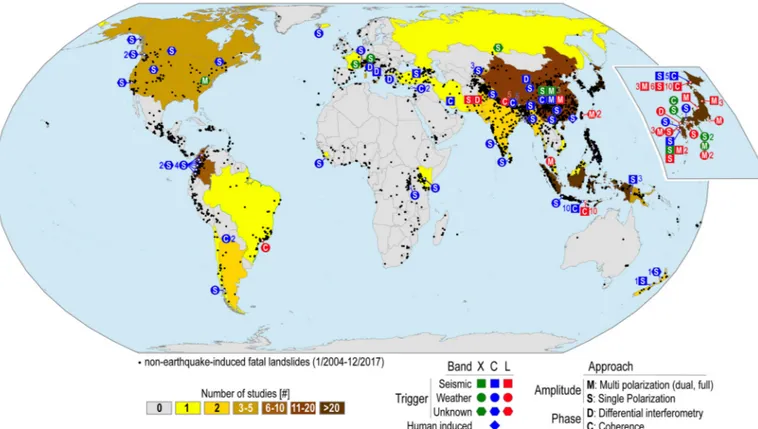
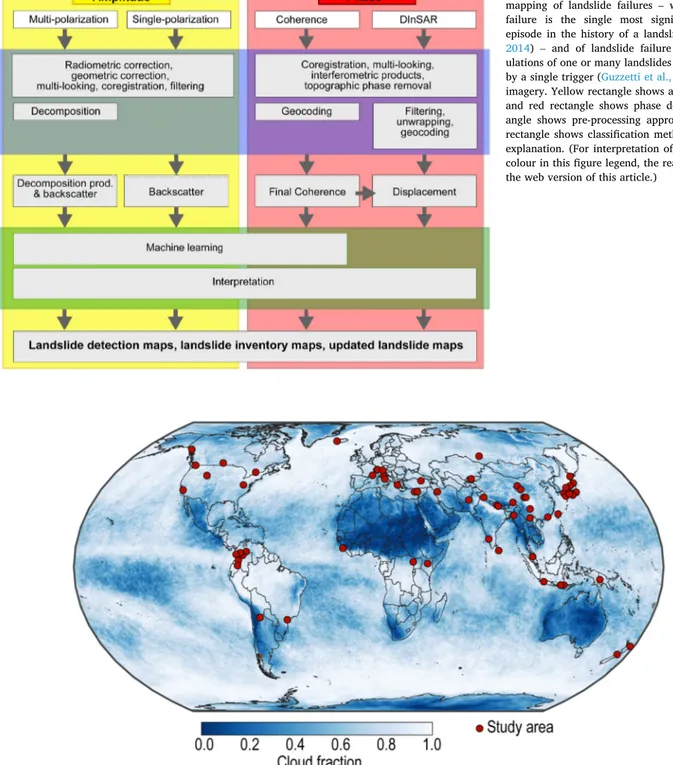
Fig. 2 portrays the geographical distribution of the study areas in the literature database.
4. Background on Synthetic Aperture Radar
Airborne and space-borne radar systems are active microwave sen- sors with an onboard, side looking antenna that illuminates the ground surface (i.e., the “target”) with single band pulses of electromagnetic radiation. Their common operational range of interest for this work includes the central frequencies of ~ 9.6 GHz, ~ 5.4 GHz, or ~ 1.3 GHz, named X-band, C-band, and L-band, respectively (IEEE, 2020) (Table 1).
The antenna receives the returning signal (i.e., the “echo”), and mea- sures the strength of the echo and the time it takes the signal to return to the antenna. The strength of the echo depends on the properties of the scattering ground surface in relation to the radiation frequency (e.g., the dielectric constant, the terrain roughness), the distance between the antenna and the ground, and the satellite view angle (Fig. 3), and it is recorded in the “amplitude” of the electromagnetic wave. The echo re- turn time depends on the relative distance between the antenna and the illuminated object (the “scatterer”) on the ground surface and it is recorded in the “phase” of the electromagnetic wave (Meyer, 2019).
The side looking configuration of SAR systems (Fig. 3) introduces a number of peculiarities. The pixel coordinates in sensor geometry are expressed in terms of distance from the radar track (“range direction” or
“across-track”), and of the sensor flying direction (“azimuth direction” or “along-track”). The “slant range” measures the distance between the
radar antenna and the portion of the illuminated ground represented by the pixel, inferred from the time delay. The “azimuth” is perpendicular to the slant range direction, and measures the along-track distance be- tween the antenna and the scatterer (Fig. 3).
The spatial resolution of the SAR images varies along the range di- rection – decreasing with the increase of the distance between the illu- minated area and the sensor – and is constant and independent from the range along the azimuth direction (Fig. 3). Both resolutions depend on multiple factors, including the sampling frequency, the orbital param- eters, and the acquisition mode (Oliver and Quegan, 2004). Image pre- processing procedures (e.g., interpolation, filtering, multi-looking) can also change the resolution of SAR images. Hence, a comparison with optical products in terms of pixel size or ground sampling distance (GSD) is meaningful only when a SAR image is projected to ground coordinates (“geocoding”).
The side looking geometry of SAR sensors introduces geometric distortions in the images, including “foreshortening”, “layovering”, and
“shadows”, in particular in mountainous or hilly terrain (Fig. 3B).
Foreshortening occurs when illuminated slopes are mapped with a compressed scale relative to its appearance. A layover is an extreme form of foreshortening where the top of a backscattering object (e.g., a mountain top) is recorded closer to the radar (in slant range) than are the lower parts of the object (e.g., the base of the slope). Shadows are caused by the lack of radar illumination (Fig. 3B) (European Space Agency, 2020b; Meyer, 2019). Geometric distortions depend on the satellite orbit parameters (e.g., ascending or descending), the satellite configuration (e.g., side of look), and the acquisition parameters (e.g., look angle, Θ), and their presence remains a problem for landslide
Fig. 2.Geographical distribution of 70 study areas in the literature database. Countries coloured based on the number of studies, in seven classes. Symbols show the approximate location of the study areas. Colour of symbol shows SAR band: green, X-band; blue, C-band; red, L-band. Shape of symbol shows main landslide trigger:
square, seismic; circle, weather; hexagon, unknown trigger; diamond, human induced slope failures. Capital letter in the symbol shows the adopted approach: C, coherence; D, differential interferometry (DInSAR); M, multi (dual, full) polarisation; S, single polarisation. Number to the side of the symbol shows number of case studies. Inset map on the right side of the main map portrays enlargement for Japan. Small black dots show non-earthquake-induced fatal landslides between 2004 and 2016 inventoried by Froude and Petley (2018) and updated recently to cover the period from January 2004 to December 2017 (Froude and Petley, personal comm. 2019). Map uses the Equal Earth map projection (EPSG:8857). (For interpretation of the references to colour in this figure legend, the reader is referred to the web version of this article.)
studies that exploit SAR imagery. An additional limitation of the side looking geometry of SAR systems is related to the fact that along-track displacements cannot be measured. Hence, ground movements along about the NS direction can hardly be detected.
5. Literature review 5.1. SAR amplitude
In the radar sensors of interest for landslide detection and mapping (Table 1), the amplitude of the transmitted and the received radiation can have a horizontal (H) or a vertical (V) geometrical orientation, or
“polarisation”. For most of the sensors, the amplitude is acquired in single (HH or VV) polarisation (SP) or in dual (HH +HV, or VV +VH) polarisation (DP). Fully-polarimetric systems acquire all the possible combinations of polarised backscatter i.e., HH, HV, VH, and VV (FP) (Czuchlewski et al., 2003). In the following, we first address works that performed a multi-polarimetric (full- or dual-polarimetric) analysis.
Next, we present articles that exploited single-polarimetric analyses.
5.1.1. Multi-polarisation
From a theoretical perspective, where a landslide removes the vegetation that covers a slope, the terrain microwave scattering prop- erties change from the adjacent areas that were not affected by the landslide, and where the vegetation has remained unchanged. As an example, a forested slope has a typical “volume” or “diffuse” back- scatter, whereas an area where a landslide has removed the forest (i.e., the vegetation) cover exhibits a backscatter signal typical of a rough, bare surface (Yamaguchi, 2012). In the case of landslide failure detec- tion and mapping, the single scattering components are obtained mainly through decompositions of matrices describing the overall scattering behaviour of the targets, namely, the Sinclair scattering matrix S for pure scatterers, or the covariance ([C2], [C3]) or coherence ([T2], [T3]) matrixes for distributed scatters, with subscripts 2 and 3 referring to dual and full polarisation systems, respectively, and whose elements are proportional to the backscattering coefficients for the different channels (i.e., σxy where subscripts x and y represent one of the possible polar- isation configurations of the sent and the return wave, respectively)
(Cloude, 1992; van Zyl, 1993; Cloude and Pottier, 1996; Praks et al., 2009; European Space Agency, 2020d). The decompositions allow to obtain parameters closely related to the physics of the various scattering mechanisms, including e.g., Entropy H, the “weighted average scat- tering” α, Anisotropy A, and Pedestal height PH (Cloude and Pottier, 1996; European Space Agency, 2020d). For visualisation purposes, the single bands can be combined to form Red, Green, Blue (RGB) or Hue, Saturation, Intensity (HSI) colour space composites, together with other indices, including e.g., (i) the direct analysis of correlations of HH-VV, HH-HV, HV-VH; (ii) the power ratios of HH/HV, HH/VV, VV/HV; and (iii) the Radar Vegetation Index, RVI that increases with the vegetation cover (Kim and van Zyl, 2001; Kim and Zyl, 2009).
In the literature database, five studies adopted qualitative methods and 15 studies used quantitative methods to classify multi-polarimetric, satellite or airborne, images and derivative products, including two studies that used dual-polarimetric images (Plank et al., 2016).
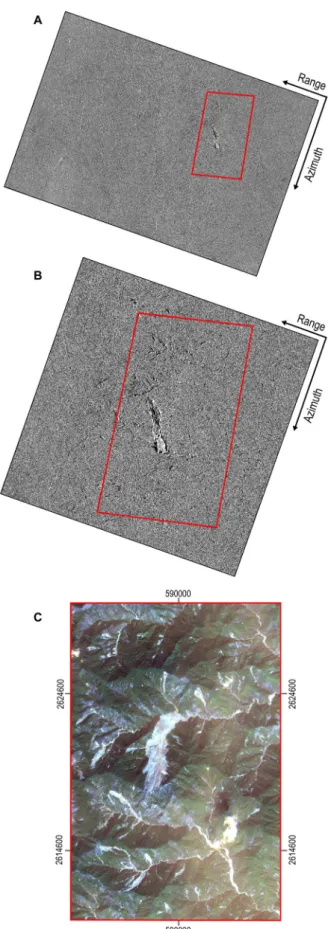
Rodriguez et al. (2002) were the first to use a hybrid classification scheme to identify polarimetric parameters for the visual detection of landslides on SAR imagery. Using L-band airborne FP AIRSAR images (NASA Jet Propulsion Laboratory, 2020a) taken about one year after the 21 September 1999, Mw 7.7, Chi Chi earthquake in Central Taiwan, the authors were able to detect and map visually the ≈ 1.25 × 10⁸m3 Tsaoling rockslide (Hung et al., 2002; Chigira et al., 2003; Chen et al., 2006). In the landslide area, the σvv, σhvσhh backscattering coefficients (Oliver and Quegan, 2004) proved sensitive to the scattering properties of the bare, rocky ground surface, whereas Entropy (H), Pedestral height (PH), and the Radar Vegetation Index (RVI) characterised well the backscatter properties of the undisturbed forest surrounding the land- slide. The same landslide was studied by Czuchlewski et al. (2003) who performed an empirical analysis of the backscattering indices H, PH, and A, obtained from the same L-band airborne FP AIRSAR images. Contrast between the surface scatter inside the landslide depletion and deposi- tional areas, and the diffuse scatter of the untouched forest outside the landslide, allowed for the visual recognition and mapping of the large rockslide. Czuchlewski et al. (2003) pointed out that in landscapes characterised by a complex land cover, and where the landslide back- scatter signature is not unique, the proposed method may result in misclassifications.
Table 1
Past and present SAR satellites and constellations useful for landslide detection and mapping, listed from oldest to most recent.
Satellite N. Band Ch Mode - Resolution Revisit Period Oper. Used
ERS-1 1 C, 5.3 GHz, 5.6 cm S (IM) 30a×26r m 35 d 7/1991–4/2001 ESA Y
JERS-1 1 L, 1.2 GHz, 23.5 cm S 18 m (ML) 44 d 11/1992–11/1998 * Y
ERS-2 1 C, 5.3 GHz, 5.6 cm S (IM) 30a×26r m 35 d 4/1995–9/2011 ESA Y
Radarsat 1 C, 5.3 GHz, 5.6 cm S (SM) 28a×25r m 24 d 11/1995–3/2013 CSA Y
Envisat ASAR 1 C, 5.3 GHz, 5.6 cm S (IM) 30a ×30r m 35 d 3/2002–4/2012 ESA Y
ALOS 1 L, 1.2 GHz, 23.6 cm S (SM) 10 m (ML) 46 d 1/2006–5/2011 JAXA Y
COSMO-SkyMed 4 X, 9.6 GHz, 3.1 cm D (SM) 5 m (ML) 16 d 6/2007– ASI Y
TerraSAR-X 2 X, 9.6 GHz, 3.1 cm F (SM) 3.3a×1.70r m 11 d 6/2007– DLR Y
Radarsat-2 1 C, 5.4 GHz, 5.5 cm F (SM) 28a×25r m 24 d 12/2007– MDA Y
Risat-1 1 C, 5.3 GHz, 5.6 cm F (FRS-2) 3a×4r m 25 d 4/2013– ISRO N
Kompsat-5 1 X, 9.6 GHz, 3.2 cm D (ST) 3 m (ML) 28 d 3/2014– KARI N
Sentinel-1 2 C, 5.4 GHz, 5.5 cm D (IW) 14.1a×2.3r m 12 d 3/2014– ESA Y
ALOS-2 1 L, 1.2 GHz, 22.9 cm F (SM) 3 m (ML) 14 d 5/2014– JAXA Y
PAZ 1 X, 9.6 GHz, 3.1 cm D (SM) 3 m (ML) 11 d 4/2018– Hisdesat N
Saocom-1 2 L, 1.2 GHz, 23.5 cm D (SB) 3 m (ML) 6 d 10/2018– CONAE N
Radarsat Cons. 3 C, 5.4 GHz, 5.5 cm F (MR) 16 m (ML) 12 d 4/2019– CSA N
Capella 36 X, 9.6 GHz, 3.1 cm S min 0.5 m nyd 9/2020– Capella
Legend: N.; number of satellites in a constellation. For Capella, the deployment of 36 satellites is planned for 2021; one operational satellite and one test satellite are currently in orbit. Band; X, C, L, frequency (GHz), wavelength (cm). Ch; channels: S, single polarisation, D, dual polarisation, F, full polarisation. Resolution (m); a, azimuth; r, range; most commonly used resolution is listed. Revisit; revisit cycle, in days (d). For constellations, the revisit cycle can be obtained dividing the listed revisit cycle by the number of satellites in the constellation (N). nyd, not yet defined. Period; period during which the satellite or constellation was/is operational.
Oper., satellite operator; *, JERS-1 was jointly operated by NASDA, MITI, and STA. Used; imagery used (Y) or not used (N) for landslide detection and mapping in the literature database. All the listed satellites allow for multiple products configurations. For used sensors (Y), we list the most comm acquisition modes i.e., SM,
“StripMap”; IW, “Interferometric Wide Swath”; IM, “Image Mode”, and the related spatial resolutions. We add ML when the resolution is given after “Multilooking” filtering. For sensors that were not used (N), we list modes similar to the modes used in similar missions, or modes of potential interest based on swath and spatial resolution i.e., ST, Standard mode; SB, Single beam.
Watanabe et al. (2012) used pre-event and post-event L-band FP ALOS imagery with 30 m ×30 m ground resolution (Table 1) to map eleven of the thirteen landslides triggered in the Dozow-sawa area, NE Japan, by the 14 June 2008, 6.9 Mw, Iwate-Miyagi Nairuku earthquake.
For the purpose, they adopted the semi-empirical model proposed by Yisok (2004) that combines backscattering coefficients with terrain surface properties (i.e., roughness and dielectric constant) to reduce the number of landslide false positives in some land cover classes, including pasture, grassland with sparse trees, and lakes. The same landslide event was investigated by Yonezawa et al. (2012) who used a Freeman-Durden decomposition (Freeman and Durden, 1993; Freeman and Durden, 1998) of the same pre-event and post-event L-band FP ALOS images. The decomposition was based on a fitting of a physically-based, three- component scattering mechanism model, including the canopy scatter, the Bragg surface scatter, and the double-bounce scattering mechanism.
The authors attributed high values of surface backscatter to the presence of newly formed, seismically induced landslides. In parallel, an unsu- pervised classification that used the H− α plane of the eigenvector decomposition (Cloude, 1992; European Space Agency, 2020d) allowed the authors to discriminate landslide areas from lakes and areas covered by snow.
Konishi and Suga (2018b) used three polarimetric indices obtained by processing pre-event and post-event L-band FP ALOS-2 imagery to detect and map landslides triggered by the 6 April 2016, 7.0 Mw,
Kumamoto earthquake, Kyoshu, Southern Japan. Adopting a change detection approach, the authors trained a random forest classifier using separately α, H, and polarimetric correlation coefficients (European Space Agency, 2020d) between the HH and VV channels in bare soil (considered to be landslides), forest, grass and crop, paddy, and urban (built-up) areas. Overall accuracy (OA) was high for the three classifi- cations (0.86, 0.85, and 0.73, respectively), confirming the potential of the technique for landslide detection and mapping.
Park and Lee (2019) also used pre-event and post-event L-band FP ALOS-2 images and polarimetric eigenvector decomposition (Cloude, 1992; European Space Agency, 2020d), to detect and map landslides triggered by the same Kumamoto earthquake in Kyoshu island, Japan.
Quad-polarisation parameters capturing signal depolarisation proper- ties revealed noticeable landslide-induced temporal changes for all local incidence angles (the angle between the satellite and the normal to the surface of the target cell), allowing for an automatic threshold-based detection of the seismically-induced landslides. The last two studies suggest that landslide detection from L-band images are useful when pre-event and post-event imagery is available.
To map 22 landslides caused by intense rainfall brought by typhoon Talas in August and September 2011 in a forested mountain region of Japan, Shibayama et al. (2015) used L-band FP ALOS-2 and FP L-band airborne Pi-SAR-L2 images (Table 1), and found that the backscattering in the landslide areas – and hence, the ability to discriminate the Fig. 3. SAR geometry. (A) Exemplification of the side looking geometry of a typical SAR system. The example is for a right-looking satellite flying along a descending orbit. Coloured polygons on the shaded relief image exemplify landslides of different types. (B) Geometric distortions and shadows typical of a SAR system. Modified after Meyer (2019). The proportions of objects, distances, and angles are exaggerated, and are not in scale.
landslides from the forested terrain – decreased with the increase of the local incidence angle. To improve the landslide detection accuracy, the authors used multiple thresholds on the backscattering based on the local incidence angle. The same landslide event was studied before by Shimada et al. (2014) who used only the airborne FP Pi-SAR-L2 images.
Interestingly, in this earlier study a dependance of the backscattering on the image incidence angle was not found, probably because of the very different image acquisition angles. A sensitivity to the observational direction of the Pi-SAR-L2 images was also found by Watanabe et al.
(2016) who detected and mapped rainfall-induced landslides caused by Typhoon Wipha in October 2013, in the Izu Oshima Island, Japan (Yang et al., 2015). The authors found that the adoption of a modelled back- scattering coefficient σ0 (Ulaby et al., 1982), H, α, A (Cloude, 1992;
European Space Agency, 2020d), and coherence between HH and VV channels (Ferretti et al., 2007; Richards, 2009b), improved discrimina- tion between landslide areas and forested areas when using small image incidence angles.
In a recent work, Ohki et al. (2020) repeated the mapping experi- ments executed previously by Watanabe et al. (2012), Shimada et al.
(2014), Shibayama et al. (2015), Watanabe et al. (2016), and partially by Park and Lee (2019), and used 3 m ×3 m resolution, FP ALOS-2 images to map landslides triggered by heavy rainfall on 5–6 July 2017, in Kyushu, Japan (Ochiai et al., 2017), and by the 6 September 2018, 6.6 Mw, Hokkaido Eastern Iburi earthquake, Northern Japan. The authors proposed empirical thresholds for the Pauli components of the coherency matrix [T3](Cloude and Pottier, 1996; European Space Agency, 2020d), and found that their mapping results depended on the site and the local image incident angle, with Cohen’s k (Cohen, 1960) in the range from 0.37 to 0.66.
Based on the results of these studies, we conclude that the image local incidence angle i.e., the angle between the radar line-of-sight (LOS) and the normal vector to the slope surface, affects the sensitivity of L- band imagery to the surface and volume backscatter and, hence, to the possibility to detect and map landslides.
Shorter wavelength, X-band and C-band imagery was also used in multi-polarisation configurations for landslide detection and mapping, often in combination with machine learning classification methods. Li et al. (2014a, 2014b) used imagery taken by an undefined Chinese high- resolution airborne FP X-band SAR system to detect and map large landslides caused by the 12 May 2008, 7.9 Mw, Wenchuan (or Sichuan) earthquake, South-central China. The authors tested various de- compositions, and found that the Yamaguchi four component decom- position (Yamaguchi, 2012) – which adds the Helix to the three standard components – performed better where the reflection symmetry condi- tion, HV =VH did not hold, and that the Cloude decomposition (H-α) (Cloude, 1992; European Space Agency, 2020d) revealed complicated scattering mechanisms in the landslide areas, which the authors attrib- uted to the landslide surface becoming relatively “rough” at the X-band scale (≈3.1 cm). The authors classified the landslide areas using a su- pervised Wishart classifier (Lee et al., 1994b), and verified a posteriori that landslide areas had higher Polarimetric Scattering Similarity (PSS) parameters (Jian Yang et al., 2001; Chen et al., 2018) compared to the surrounding forested terrain, indicating stronger surface scattering and double-bounce scattering components. The latter information proved useful to tune a PSS threshold-based classifier. The authors also studied the Pauli’s coherent decomposition of the Sinclair scattering matrix S (Cloude and Pottier, 1996; European Space Agency, 2020d), and used its three components to fill an HSI colour space (Haydn et al., 1982; Carper, 1990) in which the H channel was sensitive to both landslide areas and noise. Ultimately, a k-means unsupervised classifier (Jin and Han, 2010) was used to discriminate between the different terrain classes, including the landslide areas (Li et al., 2014a, 2014b).
A different attempt to exploit X-band DP TerraSAR-X imagery was conducted by Plank et al. (2016) who identified changes in the vege- tation cover caused by two landslides, one in Charleston, West Virginia, USA, and another near Bolshaya Talda, Kemerovo Oblast, Russia. In the
dual-polarisation [C2] eigenvector decomposition (Lee and Pottier, 2017), both landslides showed low dual-polarimetric H in post-event images in areas where before the landslides the ground was covered by vegetation. Use of the dual-polarimetric α proved critical, due to the heterogeneity of the landslide material.
Luo et al. (2016) used C-band FP Radarsat-2 (Table 1) images to detect and map landslides triggered by the 12 May 2008, 7.9 Mw, Wenchuan earthquake, China. The study revealed the efficacy of the polarimetric eigenvector (Cloude and Pottier, 1996; European Space Agency, 2020d) and the target decompositions (Freeman and Durden, 1998) to detect and map the seismically-induced landslides. The com- ponents of the two polarimetric decompositions were first clustered, the clusters were grouped into nine land-cover classes using a Wishart classifier (Lee et al., 1994b), and the landslide class was assigned to the class segments showing a dominant surface scattering component. The authors acknowledged the high false positive rate (FPR) of their classi- fication, which jeopardised the widespread application of the proposed method.
Ultimately, in a landslide susceptibility modelling exercise, Tien Bui et al. (2018) used FP AIRSAR L-band and P-band imagery, and SP AIRSAR, C-band imagery, in addition to a re-sampled 10 m ×10 m resolution DEM, to confirm the presence of 92 landslides in the Cameron highlands, central Malaysia, detected and mapped interpreting visually very-high-resolution WorldView-1 multispectral satellite imagery and digital aerial photographs, aided by field surveys. The authors concluded that the spatial resolution of the SAR images was insufficient to separate the different land cover types, but details were not given in the article.
5.1.2. Single-polarisation
For single polarisation (SP) imagery, the interaction between matter and radiation is recorded in the amplitude of the return wave and in its derivative products, including intensity I, and the backscattering co- efficients (e.g., σ0, β0, or γ0) (Oliver and Quegan, 2004; El-Darymli et al., 2014), whose values depend on the combination of land cover, including landslide, surface dielectric properties, shape, and roughness, and on system parameters (Oliver and Quegan, 2004).
In the literature database, 26 articles reported results of the use of single polarimetric, satellite or airborne, SAR imagery.
In his pioneering work Singhroy (1995) used C-band images taken by the Canada Centre for Remote Sensing (CCRS) C-HH airborne SAR at a resolution of 6 m ×6 m, to improve the quality of a landslide inventory for a part of the Fraser River valley, British Columbia, Canada. Visual interpretation of changes in tones in the SAR images allowed for the recognition of rock slumps and block slides (Hungr et al., 2014), which had not been recognised before. For visualisation purposes, Singhroy (1995) used an HSI transformation (Haydn et al., 1982; Carper, 1990) to combine the SAR images projected into geographical coordinates with a re-sampled, 6 m ×6 m, multi-spectral Landsat Thematic Mapper (TM) image (NASA, 2020) projected onto a 1:20,000 topographic base map.
The Landsat TM image provided visual information useful for landslide mapping, including the presence of sparse or dense vegetation, of thin soil with exposed rocks, and of clear cut areas.
Vargas Cuervo (1997) described a similar experiment in an area of the Easter Cordillera, Colombia, where the use of optical images to detect and map landslides was hampered by a persistent cloud cover.
The author interpreted visually a C-band ERS-1 amplitude image to identify seven landslides in a list of 458 obtained through field mapping and the visual interpretation of an optical stereoscopic pair of SPOT and Landsat TM images. In the SAR amplitude image, landslide deposits exhibited higher backscattering coefficients (shown by bright grey tones) than the unaffected areas (shown by dark grey tones), due to higher terrain roughness.
Singhroy et al. (1998) performed a similar experiment in the Sas- katchewan, Fraser, and Ottawa valleys study areas, in Canada. For the first two experiments, he used C-band Radarsat images, and for the third
experiment images taken by the Canada Centre for Remote Sensing (CCRS) C-HH airborne SAR (Table 1). A result of the study was a qual- itative analysis on the impact of different Radarsat viewing geometries in the Fraser valley where the Radarsat Extended High beam mode, EH6 (57–59), proved more effective in recognising landslide features than the Standard beam mode, S1, on the steep slopes of the valley.
Chorowicz et al. (1998) used a C-band ERS-1 (12.5 m ×12.5 m pixel) and an L-band JERS-1 (18 m ×18 m pixel) images (Table 1), together with a coarse resolution, 100 m ×100 m DEM, to prepare two simulated image stereo-pairs. Visual interpretation of the pseudo-stereoscopic images allowed for the recognition of small “geomorphic features” in the landslide areas, and the identification and mapping of fourteen landslides in Paz de Rio, Colombia. Details on the type and size of the landslides were not given in the article, but inspection of Fig. 4 in the article indicates that the largest landslide was about 600 m2. The conclusion of the study was that variations in the backscatter inside and outside the landslides due to different terrain roughness, were not suf- ficiently large for the visual recognition of all the landslides, and that only the largest landslides could be mapped, due to the limited ground resolution of the imagery.
After these early works, there is a gap of about a decade in the literature database before the next article describing the visual inter- pretation of SAR images to detect and map landslides. While mapping the disruption caused by the 12 May 2008, 7.9 Mw, Wenchuan earth- quake in Beichuan, China, Balz and Liao (2010) recognised and mapped the seismically induced landslides using post-event X-band, Stripmap TerraSAR-X intensity images with a resolution of about 3 m ×3 m (Table 1). Visual recognition of the landslides was possible due to the different backscatter of the landslide areas, compared to the nearby built-up areas. In the images, the presence of the landslides was revealed by abrupt tonal changes in the landslide scarp (source) and toe (depo- sitional) areas.
In a later work, Xue et al. (2011) discussed the use of SAR σ0, in combination with optical imagery, to identify landslide-related geolog- ical features and faults. Where the landslide surface was bare, and al- luvial Quaternary deposits cropped out, the radar echo was affected mainly by terrain roughness, and by the water content and structure of the shallow soil. Where the soil water content was high, and the terrain surface was rough, the σ0 image tone appeared light grey, revealing the presence of the landslide, whereas where the terrain was stable (i.e., free of recent landslides) and vegetated, the image tone was dark grey.
The synergic use of optical and SAR imagery was further explored by Mwaniki et al. (2017) who tested the possibility of using C-band Sentinel-1 imagery to increase edge identification when “fused” to Landsat 8 Operational Land Imager (OLI) images, to recognise landslides in Kenya. The authors filtered the SAR data using the (Frost et al., 1982) and (Lee, 1986; Lee et al., 1994a) filters to outline the image textural information.
A few authors attempted to use indices and measures of backscat- tering changes for landslide detection and mapping. Furuta and Tomiyama (2008) were able to detect and map a few seismically- induced landslides triggered by the 29 October 2008, Mw 6.4, Zirat earthquake, in Western Pakistan, using the normalised difference be- tween pre-event and post-event scatter (NDSI) L-band ALOS σ0 imagery.
However, the authors failed to recognise a large, seismically-induced rock slide. Spatial variations in the NDSI changes were also used by Konishi and Suga (2017) who mapped large debris flows caused by a high-intensity rainfall event on 20 August 2014 in Hiroshima, Central Japan (Wang et al., 2015) exploiting changes in the backscattering properties of the topographic surface caused by sediments and driftwood mobilised by the large debris flows. Tessari et al. (2017) interpreted visually amplitude changes in X-band COSMO-SkyMed images to detect a 60 m wide by 400 m long roto-translational landslide triggered by heavy rainfall in November 2017, in the Val Maso municipality, NE Italy.
To map landslides caused by record-breaking rainfall brought by
Typhoon Talas in the Kii Peninsula, south-central Japan, beginning on 30 August 2011, Suga and Konishi (2012) and Konishi and Suga (2018a) investigated the potential of thresholded backscattering coefficient dif- ference and intensity correlation measures, obtained from pre-event and post-event X-band, COSMO-SkyMed images multi-looked at a ground resolution of 5 m ×5 m. In particular, Konishi and Suga (2018a) showed that the intensity correlation measures obtained by applying the Lee (1981) and Frost et al. (1982) filters with different-sized moving kernels (Matsuoka and Yamazaki, 2004), outperformed the backscattering co- efficient. Results were compared to a landslide inventory prepared exploiting a 0.7 m ×0.7 m resolution EROS-B optical image. Large kernels of 19 ×19 pixels (9025 m2) for the backscattering coefficient difference, and of 25 ×25 pixels (15,625 m2) for the intensity correla- tion, proved to be the best options to detect and map landslides up to AL
≈3.7 ×10⁵m2.
Liu et al. (2018) also attempted to use changes of the intensity measured for C-band Sentinel-1 images to visually detect and map three new landslides occurred on 1 October 2017 in the loess area of Dang- chuan, Southern China, for a total volume of mobilised debris of VL = 33.9 ×10⁴m3. However, given the ground resolution of the satellite imagery (16 m ×16 m), and the relatively small size of the landslides (≈ 140 m ×270 m), mapping of the landslides was not accurate.
Mondini et al. (2019) were the first to use changes in the β0 back- scattering coefficient, also called radar brightness coefficient, between pre-event and post-event C-band Sentinel-1 images for the systematic detection and mapping of rapid moving landslides. For a set of 32 landslides of very different sizes (0.01 ×10⁶m2 ≤AL ≤21.0 ×10⁶m2) selected randomly in different geological, morphological, and environ- mental settings globally, a team of geomorphologists trained in the vi- sual interpretation of aerial and satellite imagery for landslide mapping identified correctly 27 (84%) of the studied landslides, without any a- priori knowledge on the location, type, and size of the slope failures. In one case, they recognised the landslide only after knowing its exact location. In at least six cases, the landslide events included multiple slope failures. In three of the four unsuccessful cases, the geometry of the acquisition was considered responsible for the failed detection, and not the size or the type of the landslide.
Attempting to map landslides triggered by the 16 April 2016, 7.0 Mw, Kumamoto earthquake in Kyushu, Southern Japan, Uemoto et al. (2019) used airborne, X-band Pi-SAR2 images (Table 1) and combined thresh- olded changes in amplitude and terrain elevation in highly coherent pixels. A conclusion of the work was that, in forested areas, the occur- rence of landslides (of unknown type and size) should result in (i) an increase of the amplitude and a decrease in the terrain elevation in the upper part of the landslide (i.e., the source or depletion area), (ii) a decrease of both amplitude and elevation in the main landslide deposit, and (iii) an increase of amplitude and elevation in the lower part of the landslide (i.e., in the deposition area). Absolute amplitude changes (resulting from changes in the surface backscatter) ≥5 Db, and changes in elevation ≥5 m were selected as thresholds to detect landslides. To measure the performance of their classifications, the authors confronted their new landslide map against an existing inventory prepared through the visual interpretation of stereoscopic areal photographs taken by the Japanese National Research Institute for Earth Science and Disaster Resilience (NIED). The two maps showed an inter-rater reliability of 0.60 and 0.46 in two separate areas, which was deemed moderate by the authors. Detection problems were related mainly to the inability to detect “small” (≈50 m ×50 m, AL =2500 m2) landslides, and the limited detectability of “medium size” (≈200 m ×500 m, AL =1.0 ×10⁵m2) landslides, mainly due to limits in the information of the terrain eleva- tion changes.
The remaining articles in the literature database are recent, and address the problem of landslide recognition and mapping using ma- chine learning techniques (Michie et al., 1994; Richards and Jia, 2006).
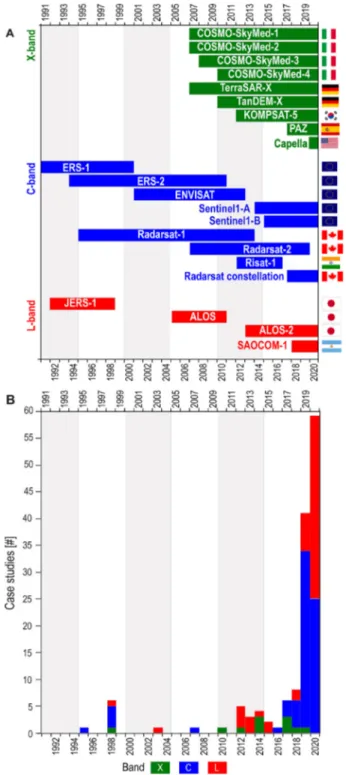
Mondini et al. (2017) measured the increase in the spatial autocor- relation (Griffith, 1987; Griffith and Chun, 2016) of a time series of
Fig. 4. Gigantic, rainfall-induced Tozang landslide, Myanmar, July 2015. (A) In radar azimuth–range coordinates, image shows natural logarithm of the ratio between post-event and pre-event β0 radar brightness coefficient of VV polarised, C-band, ESA Sentinel-1 images taken along descending orbits. Red box shows approximate location of (C). (B) Enlargement of a portion of (A). “Salt & pepper” pattern reveals forested terrain where landslides did not occur. Clusters of similar black or white pixels show the Tozang landslide. (C) GeoEye image of the landslide area, in UTM WGS84 Zone 46 projected coordinates. Whitish areas are landslide areas. (For interpretation of the references to colour in this figure legend, the reader is referred to the web version of this article.)
measurements of changes of the β0 radar brightness coefficient in C-band Sentinel-1 images, which the author attributed to a group of rainfall- induced landslides – mainly debris flows and slide flows – caused by heavy rainfall in Tozang, Myanmar, in July 2015. Landslides appeared as organised clusters within a matrix of speckles in an image showing the natural logarithm of the ratio between the post-event and the pre-event β0 radar brightness coefficient images. An image optimal segmentation revealed that the size of the segments delineating the landslides was within the 95% percentile of the distribution of the areas of the segments.
A similar experiment was conducted by Esposito et al. (2018) who used a “mean shift” clustering method (Yizong Cheng, 1995; Comaniciu and Meer, 2002) to detect and map seismically-induced landslides triggered on 25 February 2018 by the 7.5 Mw Papua New Guinea earthquake in the Tagari River Valley of central Papua New Guinea. The experiment was extended recently by Esposito et al. (2020) who intro- duced an automatic selection of the segments containing landslides using statistics of the image changes. The algorithm was calibrated on landslides triggered by the 25 February 2018 earthquake, and then applied to detect landslides triggered by the 6 March 2018, 6.7 Mw
earthquake in the same area. The work confirmed the potential of continuous SAR-based satellite monitoring of areas where seismically- induced landslides are frequent and abundant.
In a study of landslides triggered by the 6 September 2018, 6.6 Mw, Hokkaido Eastern Iburi earthquake, Northern Japan, Ge et al. (2019) compared the performances of the intensity difference and its absolute value, and the average of the absolute value over a moving window whose size was optimised through an AUC ROC analysis. The indices were used as covariates in a linear discriminant analysis, obtaining classification performance indices (i) for the correlation coefficient dabs2, OA =69.36%, recall =87.76%, precision =47.04%, and F1-score = 61.25%, and (ii) for the correlation coefficient difference, OA =64.57%, recall =81.68%, precision =42.59%, and F1-score =55.99%. The high recall indicated that the parameters were relevant to detect landslides, whereas the low precision was the result of many false positive non- landslide pixels, mainly in the vicinity of a landslide, where surface erosion was indistinguishable from landslide related changes, including vegetation tilt. The same landslide event was studied by Aimaiti et al.
(2019) who used the same ALOS-2 images and the same performance indices to construct a decision tree based on geomorphological variables and “ad-hoc” thresholds. The study revealed that imagery taken along descending orbits performed better than the corresponding imagery taken along ascending orbits, because of the more favourable view point, and that the combined use of images taken along ascending and descending orbits performed better than the images taken from a single orbit, either ascending or descending.
Mabu et al. (2020) applied a Convolutional Neural Network (CNN) (Goodfellow et al., 2016) to a post-event L-band, 3 m ×3 m, ALOS-2 image (Table 1) to detect landslides triggered by heavy rainfall on 5–6 July 2017, in Kyushu, Japan (Ochiai et al., 2017). The trained CNN was capable of distinguishing between different size patches (from 8 ×8 to 128 ×128 pixels) of (probably) intensity values having (and not having) landslides, with a best accuracy of 0.67 and a best F-score of 0.70.
Ultimately, to map landslides triggered by the 6 September 2018, 6.6 Mw Hokkaido Eastern Iburi earthquake, Northern Japan, Jung and Yun (2020) used 3 m ×3 m, L-band HH ALOS-2 imagery, 16 ×16 multi- looked, and investigated the potential of bi-temporal, de-trended multi- temporal intensity and intensity-correlation change detection ap- proaches in different land cover types. The bi-temporal intensity approach proved able to detect landslides in urban areas – due to the strong backscatter changes – and in forest terrain with relative low noise, but resulted in a high rate of false positives in croplands, where better performances were obtained by the intensity-correlation approach, which was closely related to the spatial distribution of the backscatter changes.
5.2. SAR phase
The electromagnetic radiation transmitted by a radar antenna rea- ches the ground and returns to the antenna in a time that depends on the two-way travel distance, 2R of the radiation (Fig. 3A). Under the approximation of a purely sinusoidal nature of the transmitted signal, the delay τ corresponds to a phase change ϕ i.e., the portion of the wavelength that measures the last fraction of the two-way travel dis- tance, between the transmitted and the received signals (Ferretti et al., 2007; Richards, 2009a). The phase is measured recording twice the amplitude with an offset in phase of π/2 radians, in-phase and quadra- ture components (Ferretti et al., 2007; Richards, 2009a) and, by itself, it does not provide any useful information for landslide detection and mapping, because it cannot estimate the radiation backscattering. This is because individual scatterers within each image pixel are of much smaller size than the resolution of the SAR image to be uniformly distributed in the range [− π,+π] (“speckle-like”) (Oliver and Quegan, 2004). Further, a single image cannot be used to measure the distance between the antenna and the ground surface, because no geometric relationship exists between the phases of the different pixels.
5.2.1. Bi-temporal differential interferometry
Flying around the Earth along different orbits, a SAR sensor illumi- nates the same target on the ground surface from (slightly) different viewing angles during different passages. If the target area on the ground has moved between two satellite acquisitions (e.g., it was displaced by a landslide), with a component of the movement, along the satellite line of sight (LOS), the phase difference between the two images obtained by cross multiplying the “first scene” image with the complex conjugate of the “second scene” image (i.e., the “interferogram”), has a component related to the ground deformation (caused e.g., by a moving landslide) and other components that can be removed entirely using pre-processing techniques, removed partially using filters, or reduced using the same acquisition geometry and short revisit times (Rocca et al., 2000; Ferretti et al., 2007; Richards, 2009a). Changes in the interferometric phase between adjacent pixels in an interferogram allow to outline the spatial pattern of the surface deformation caused e.g., by a slope movement occurred between two successive images. For visualisation purposes, the deformation pattern is shown typically using a colour scheme that re- peats every 2π cycles i.e., each colour “fringe” represents a (relative) displacement along the satellite LOS of about λ/2 (Ferretti et al., 2007;
Richards, 2009a). To obtain the “true” deformation, one has to add to the wrapped phase the number of 2π-multiples, measuring the two way distance between the satellite and the ground target (“phase unwrap- ping”) (Rocca et al., 2000; Ferretti et al., 2007; Richards, 2009a). Phase unwrapping can be important in the case of landslide scenarios, where usually sharp discontinuities are caused at the landslides borders (Manconi, 2019).
In the literature database, seven articles discuss the use of bi- temporal differential interferometry – or DInSAR – techniques to detect and map landslide failures.
Moro et al. (2007) used DInSAR to investigate the surface deforma- tion caused by the 1997 Colfiorito seismic sequence (Basil et al., 1998) – one of the first earthquakes whose surface deformation was measured using DInSAR (Stramondo et al., 1999), and found local anomalies in the fringes obtained by processing a pair of C-band ERS-1/2 images taken one before and the other after three, moderate-magnitude, 5.6, 5.9, and 5.5 Ms earthquakes occurred on 26 September and 14 October 1997, in Central Italy. The local anomalies could not be explained by the fault displacement modelled adopting the (Okada, 1985) elastic formulation.
A detailed photogeological analysis of the areas where the “anomalous”
surface deformations were observed, revealed evidence of morpholog- ical elements that were associated to co-seismic (because they were evident in the interferometric fringes) activity of deep-seated gravita- tional slope deformations, or to (re-)activations of parts of large, deep- seated, dormant landslides. Interestingly, the slope deformations