genetic variation of the endangered plant species Dianthus gratianopolitanus (Cheddar pink)
Christina M. Putz, Christoph Schmid & Christoph Reisch
Institute of Botany, University of Regensburg, 93040 Regensburg, Germany
Keywords
Amplified fragment length polymorphisms, Dianthus gratianopolitanus, distribution range, genetic variation, isolation, population structure, rarity, reproductive traits.
Correspondence
Christoph Reisch, Institute of Botany, University of Regensburg, D-93040 Regensburg, Germany.
Tel: ++49 + 941-943-3131;
Fax: ++49 + 941-943-3106;
E-mail: christoph.reisch@biologie.
uni-regensburg.de Funding Information
Financial support by the Government of the Upper Palatinate.
Received: 15 June 2015; Accepted: 21 June 2015
doi: 10.1002/ece3.1611
Abstract
The endangered plant species Dianthus gratianopolitanus exhibits a highly frag- mented distribution range comprising many isolated populations. Based upon this pattern of distribution, we selected a study region in Switzerland with a lower magnitude of isolation (Swiss Jura) and another study region in Germany with a higher degree of isolation (Franconian Jura). In each region, we chose ten populations to analyze population structure, reproduction, and genetic vari- ation in a comparative approach. Therefore, we determined population density, cushion size, and cushion density to analyze population structure, investigated reproductive traits, including number of flowers, capsules, and germination rate, and analyzed amplified fragment length polymorphisms to study genetic variation. Population and cushion density were credibly higher in German than in Swiss populations, whereas reproductive traits and genetic variation within populations were similar in both study regions. However, genetic variation among populations and isolation by distance were stronger in Germany than in Switzerland. Generally, cushion size and density as well as flower and capsule production increased with population size and density, whereas genetic varia- tion decreased with population density. In contrast to our assumptions, we observed denser populations and cushions in the region with the higher magni- tude of isolation, whereas reproductive traits and genetic variation within popu- lations were comparable in both regions. This corroborates the assumption that stronger isolation must not necessarily result in the loss of fitness and genetic variation. Furthermore, it supports our conclusion that the protection of strongly isolated populations contributes essentially to the conservation of a species’ full evolutionary potential.
Introduction
Rare plant species are largely subjected to the effects of isolation (Silcock and Fensham 2014). The impact of iso- lation on so-called new rare species (Huenneke 1991), which have been formerly widespread and are now rare, as a result of landscape fragmentation processes, has been analyzed in numerous studies during the past decades (Hooftman et al. 2004; Galeuchet et al. 2005; Schleuning et al. 2009). It is widely accepted that the fragmentation of formerly common species due to anthropogenic land- use changes results in stronger geographic isolation of smaller populations (Ouborg et al. 2006). As a result, the
exchange of pollen and seeds between populations is restricted, which means that gene flow is limited (Listl and Reisch 2014). Therefore, genetic variation within populations decreases, while genetic variation between populations increases. In previous studies, it has been shown that population size, fitness, and genetic variation are strongly correlated (Leimu et al. 2006). The loss of genetic variation may, therefore, lead to impaired genera- tive (Schmidt and Jensen 2000) or diminished vegetative performance (de Jong and Klinkhamer 1994; Chaloupecka and Leps 2004). This potentially causes an increased sus- ceptibility to pathogens and herbivores on the short term (Ellstrand and Elam 1993; Schmid and Matthies 1994),
and a diminished evolutionary capacity to environmental changes, increasing extinction probability on the long term (Matthies et al. 2004; Ouborg et al. 2006).
However, naturally fragmented and isolated popula- tions of “old rare species” (Huenneke 1991), which have been always rare and occur in special habitats, have much less been in the research focus during the last decades (Hensen et al. 2010; Vogler and Reisch 2013). Previously, it has been demonstrated that rare species are less suscep- tible to the effects of fragmentation than common species (Honnay and Jacquemyn 2007). This is supported by the results of a study about isolated populations of alpine plant species (Kuss et al. 2008). The authors of this study originally assumed that genetic variation should decrease with increasing isolation. However, they detected high levels of genetic variation also in strongly isolated popula- tions of alpine plant species. The authors therefore con- cluded “that natural fragmentation does not necessarily result in particularly high levels of mean genetic popula- tion differentiation or in a loss of genetic diversity within populations” (Kuss et al. 2008).
The population structure and reproduction of naturally rare species has less been investigated than genetic varia- tion (Garcıa et al. 2000; Dorken and Eckert 2001; Jump and Woodward 2003). Most of these studies analyzed population structure and reproduction in the context of the abundant center model (ACM), which postulates that populations of a species become progressively smaller, less dense, less frequent, and more spatially isolated approach- ing the edge of a species’ range (Lawton 1993; Sagarin and Gaines 2002; Sagarin et al. 2006). It is assumed that, as a result of this pattern, levels of reproduction and recruitment decrease among isolated populations. This assumption is supported by several studies of “new rare species”, which showed that, for example, pollination suc- cess decreases with increasing isolation and that fragmen- tation in general affects the reproductive success (Jennersten 1988; Kolb 2005).
Dianthus gratianopolitanus occurs on naturally isolated limestone outcrops (Hegi 1986) and exhibits a highly fragmented distribution range comprising many strongly isolated populations (Meusel et al. 1978; K€asermann 1999). The populations of the species occur continuously throughout the center of the distribution range in the Swiss Jura but become more and more isolated toward the periphery of the distribution range. The most periph- eral populations are hundreds of kilometers distant to other populations (K€asermann 1999). Based upon this pattern of distribution, we selected two study regions from the distribution range of the species with a different magnitude of isolation to analyze population structure, reproduction, and genetic variation in a comparative approach.
Based upon the outcome of previous studies about the effects of isolation on recently fragmented populations of formerly widespread species (Fahrig 2003; Jacquemyn et al. 2007; Schleuning et al. 2009), we expected that increasing isolation should reduce population size and density and the reproduction of D. gratianopolitanus.
Moreover, genetic variation within populations should be decreased, while genetic variation between populations should be increased.
Methods
Study species
Dianthus gratianopolitanus Vill. (Hegi 1986) is a peren- nial, long-lived plant which forms cushions or mats con- sisting of numerous hemi-rosettes (K€asermann 1999). The species colonizes rocky ridges and outcrops mainly of limestone (Hegi 1986). Besides vegetative reproduction by shoots, conspicuous pale to dark pink and odorant flow- ers attract diurnal butterflies as well as diurnal and noc- turnal moths between end of May and June (Erhardt 1990). Each pollinated flower generates a capsule contain- ing anemochorous diaspors (K€asermann 1999).
D. gratianopolitanus is a fairly rare pre-alpine plant endemic to central Europe with a highly fragmented dis- tribution, which seems to be relic from periods previous to the last glaciations (Erhardt 1990). The current distri- bution center is a continuous area along the Jura Moun- tains (French, Swiss, and Swabian Jura), but the species also exhibits more isolated populations in low mountain ranges of middle and eastern France, southern Belgium, Germany, Bohemia, and the west-polish lowland. The most isolated population is found in south England (Cheddar Gorge, N. Somerset) (K€asermann 1999).
Although D. gratianopolitanus is naturally rare, more and more populations decline and disappear, mainly due to the effects of hiking and climbing (Welk 2002), because they are overgrown by shrubs and trees and may be also due to climatic changes and the input of nitrogen.
The species is therefore listed in the German red data book with category three (Korneck et al. 1996).
Study design
We selected for our investigation two study regions, where the populations of D. gratianopolitanusexhibited a different magnitude of isolation. One region was located in Switzerland (Swiss Jura), near to the potential center of the distribution range, and the other study region was located in Germany (Franconian Jura), more closely to the periphery of the distribution range. From each region, we analyzed each ten populations (Fig. 1).
The magnitude of isolation was characterized based upon the quadrants of the grid of topographic maps (TK 25, scale 1:25000), which is officially used for the design of species distribution maps in Germany. This grid was extended to Switzerland and the locations, where the spe- cies occurs in Switzerland were transferred from the Swiss distribution map in the accordant quadrants. Based upon this dataset, we determined the number of quadrants within a radius of 30 km around the selected study popu- lations, where D. gratianopolitanusoccurs. The two study regions differed significantly in the magnitude of isolation (U test: P=0.000). In Switzerland, D. gratianopolitanus occurred on average in 33.5 quadrants around the selected populations, whereas in Germany, the species was recorded on average in 12.2 quadrants around the study populations. The magnitude of isolation was, therefore, higher in Germany than in Switzerland.
In both regions, we studied 15 individuals (cushions) per population, which were randomly chosen across the colonized habitat and represents about 50% of the num- ber of individuals per population. However, in the small- est population, only 12 cushions were available (Table 1).
All data were collected within one vegetation period from May to July.
Population structure
The number of individuals in each population was enu- merated by inspecting the whole habitat area, thereby one spatially separated cushion was regarded as one individ- ual. The size of the habitat area (e.g., rocky ridge) was estimated using topographic maps. Based upon the size of the area and the number of individuals, population den- sity was calculated as cushions per square meter and is, therefore, an indicator for habitat occupancy. Further- more, width and length of each individual was measured to calculate the cushion size in cm². Cushion density was estimated as the number of shoots per square meter, counted in small plots of 109 10 cm and extrapolated to 1 m².
Reproductive traits
In the field, the number of flowers and capsules of each investigated cushion were counted in May and July, respectively. Using these data, we calculated fruit set, as number of capsules divided by number of flowers. Seeds were collected from the selected individuals with regard to nature conservation, which means that we did not col- lect all available seeds, but only 20% of the seeds to allow natural reproduction in the population. As populations of the species are generally small, we obtained not enough seeds to test all germination treatments for all populations
(A) (B)
Figure 1. Geographic position of the investigated populations in the two study regions in Switzerland (A) and Germany (B).
Table 1. Analyzed populations of D. gratianopolitanus with their number, label, study region (S, Switzerland; G, Germany), number of sampled individuals (n), and altitude (m a. s. l.). For conservation rea- sons, we refrain from presenting the exact geographic coordinates (latitude and longitude). Data are, however, available from the authors.
No. Label Population Area n Altitude
Switzerland
1 LC Le Chasseron S 15 1600
2 CR Col de Roches S 15 910
3 CF Chr€uzflue S 15 700
4 BK Balmfluech€opfli S 15 1250
5 RF Ravellen S 15 620
6 BR Br€anten S 15 600
7 HF Holzflue S 15 730
8 GE Geissflue, S 15 600
9 FB Ruine Froburg S 15 830
10 SF S€aliflue S 15 530
Germany
11 SL Schwedenleite G 15 480
12 FL Fischleiten G 15 470
13 RK Rosskopf G 15 460
14 KF Kachelfelsen G 15 450
15 FH Falkenhorst G 15 450
16 SE Schleuse G 15 450
17 SB Steinerbr€uckl G 12 400
18 GB Grain am Berg G 15 350
19 AC Achtel G 15 420
20 GF Grundfelsen G 15 490
separately. Therefore, tests were conducted with pooled seeds from the two study regions, respectively, to receive a sufficient number of replications. Different treatments were used to evaluate the germination response of seeds from Swiss and German populations associated with dif- ferent environmental conditions which indicate a gap detection mechanism and longevity of the seeds. In this way, we tested whether differences between the two study regions occur at different treatments. We analyzed germi- nation at four treatments, which were generally used by default in germination ecological analyses, and have turned out to be the most suitable conditions to test the germination of central European plants. They are derived from typical temperatures at day and night (Baskin et al.
2006). We applied three treatments with an 8 h light per- iod: constant 14°C, constant 22°C, and fluctuating 22°C day/14°C night. A further germination test was per- formed under 22°/14°C fluctuating conditions in dark- ness.
Seeds were placed uniformly in petri dishes (92 916 mm) lined with a double layer of filter paper (Sartorius, Ø90 mm) moistened with 5 mL of distilled water. To prevent evaporation, each petri dish was sealed separately with parafilm. Per treatment eight petri dishes as replicates with 10 seeds each were kept in stacks of eight and rotated daily. All experiments were placed in an incubator (Licht-Thermostat, Rubarth Apparate GmbH) with a constant humidity of 65%. For germination in darkness, the petri dishes were kept in a black box and scored under green light (25 W) to exclude any influence of light of a different wavelength. Germination was recorded daily for the first 10 days, then twice a week for a total of 6 weeks. Germinated seeds were removed.
Genetic variation
Shoots with young, green leaves were sampled of 15 cush- ions per populations for genetic analysis, and in total, 297 individuals were analyzed. Single shoots were placed in permeable bags, immediately stored in sealed containers and dried on silica gel. Genomic DNA was isolated from dry leaf material using the CTAB-based method (Rogers and Bendich 1994) as described before (Reisch and Kellermeier 2007). Concentrations of the DNA extracts were measured photometrically. DNA solutions were diluted with water for molecular biology to 7.8 ng/lL and used for the analysis of amplified fragment length poly- morphisms (AFLPs), which were conducted concordant with the protocol from Beckmann Coulter as described previously (Bylebyl et al. 2008; Reisch 2008). Three pri- mer combinations were chosen for a subsequent selective PCR. For detection, EcoRI primers labeled with different fluorescent dyes (M-CAT/D2-E-ACC, M-CAT/D3-E-ACG,
M-CTT/D4-E-ACT; Beckman Coulter, Krefeld, Germany) were used. Selective PCR products were diluted threefold (D2), twofold (D3), and eightfold (D4) with 19 TE0.1
buffer for AFLP. After redissolving the pelleted DNA in a mixture of 24.8 lL sample loading solution (SLS, Beck- man Coulter) and 0.2lL CEQ Size Standard 400 (Beck- man Coulter), selective PCR products were separated by capillary gel electrophoresis on an automated sequencer (CEQ 8000, Beckmann Coulter).
Results were examined using the CEQ 8000 software (Beckman Coulter) and analyzed using the software Bion- umerics 6.6 (Applied Maths, Kortrijk, Belgium). From the computed gels, only those fragments were taken into account that showed intense and articulate bands. Sam- ples yielding no clear banding pattern or obviously repre- senting PCR artefacts were repeated or finally excluded.
Reproducibility of molecular analyses was investigated with 10% of all analyzed samples by means of estimating the genotyping error rate (Bonin et al. 2004), which was 3.2%.
Statistical analysis
From the AFLP bands, a binary (0/1) matrix was created wherein the presence of a fragment of a given length was counted as 1 and the absence as 0. The final matrix and all further calculations comprised 297 samples. Employing the software PopGene 1.32 (Yeh and Layton 1979), genetic variation within populations was computed as the percentage of polymorphic loci %PL, as Nei’s gene diver- sity He (H=1– sum(pi)2) and as Shannon’s Information Index SI (SI =sum(pi)ln(pi); pi=allele frequency). The apportionment of genetic variation within and between populations and subpopulations was assessed by hierar- chical AMOVA with the software GenAlEx 6.3 (Peakall and Smouse 2001). In a Mantel test (999 permutations), the matrix of pairwise genetic distances (ΦPT) was corre- lated with a matrix of the respective geographic distances (km) among populations (Mantel 1967).
Population parameters were compared between regions by means of Bayesian two-group models. The analysis was carried out using Markov Chain Monte Carlo sam- pling (MCMC) with the JAGS 3.4.0 software package (Plummer 2003). Habitat area was modeled as being gamma-distributed, and all other parameters could be approximated by Student’s t-distributions. Population density and the number of capsules had to be square root transformed prior to analyses. All models were executed with four chains and afterward checked for chain conver- gence. Highest density intervals (HDI) were computed for the group mean difference and considered credible, when the HDI excluded zero. All estimated parameters had an effective sample size (ESS) of>10 k.
For the analysis of the seed germination experiment, a Bayesian approach was chosen for both its higher flexibil- ity and informative value as compared to classical NHST procedures. Only data of day 7 were analyzed, when over- all germination was close to 50%. Modeling and interpre- tation were carried out using the software packages R 3.2.0 (R-Core-Team, 2013) and RStan 2.6.0 for Hamilto- nian Monte Carlo (HMC) sampling (Stan-Development- Team, 2014) as well as utility functions provided by Kruschke (2015). The model involved a hierarchical two- way design with the logistic as the inverse link function.
Besides the deflection parameters and their corresponding standard deviations, the model estimated the germination per factor combination as being beta distributed with equal concentration parameters between cells. This is a Bayesian analogue to a two-way logistic ANOVA. The complete and commented Stan model specification is available from the supplementary material. All priors were set to be uninformed using vague gamma and normal distributions. Sampling was carried out with four HMC chains with 500 k steps each with thinning set to every
25th step, a burn-in period of 1000 steps and 500 steps for adaption. All parameters were checked for chain con- vergence. Autocorrelation was assessed as the ESS aiming at a lower limit of 10 k for the relevant parameters. Dif- ferences in germination between treatments and regions, respectively, were subsequently analyzed using contrasts of the corresponding marginal distributions.
We tested the relationship between population struc- ture parameters, reproductive traits, and genetic variation using correlation analyses based on Spearman’s rank cor- relation coefficient with IBM SPSS Statistics 20 (IBM Corp.) for Windows.
Results
Population structure
The analyzed populations ofD. gratianopolitanusoccurred in credibly smaller habitat areas in Switzerland than in Germany. However, the number of individuals (12–60) was quite consistent in both regions (Table 2). Hence,
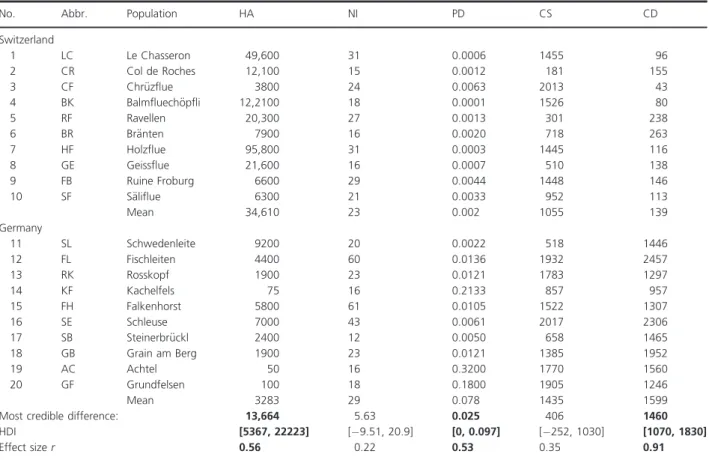
Table 2. Occurrence ofD. gratianopolitanuswithin a 30 km radius, habitat area, and population structure of all investigated populations. Mean values for the study regions and results of the statistical analysis are given. (NQ, number of quadrants of the topographic maps, where the species occurs within a 30 km radius around the studied populations; HA, habitat area in m²; NI, number of individuals; PD, population density in cushions per m²; CS, cushion size in cm²; CD, cushion density in shoots per m²).
No. Abbr. Population HA NI PD CS CD
Switzerland
1 LC Le Chasseron 49,600 31 0.0006 1455 96
2 CR Col de Roches 12,100 15 0.0012 181 155
3 CF Chr€uzflue 3800 24 0.0063 2013 43
4 BK Balmfluech€opfli 12,2100 18 0.0001 1526 80
5 RF Ravellen 20,300 27 0.0013 301 238
6 BR Br€anten 7900 16 0.0020 718 263
7 HF Holzflue 95,800 31 0.0003 1445 116
8 GE Geissflue 21,600 16 0.0007 510 138
9 FB Ruine Froburg 6600 29 0.0044 1448 146
10 SF S€aliflue 6300 21 0.0033 952 113
Mean 34,610 23 0.002 1055 139
Germany
11 SL Schwedenleite 9200 20 0.0022 518 1446
12 FL Fischleiten 4400 60 0.0136 1932 2457
13 RK Rosskopf 1900 23 0.0121 1783 1297
14 KF Kachelfels 75 16 0.2133 857 957
15 FH Falkenhorst 5800 61 0.0105 1522 1307
16 SE Schleuse 7000 43 0.0061 2017 2306
17 SB Steinerbr€uckl 2400 12 0.0050 658 1465
18 GB Grain am Berg 1900 23 0.0121 1385 1952
19 AC Achtel 50 16 0.3200 1770 1560
20 GF Grundfelsen 100 18 0.1800 1905 1246
Mean 3283 29 0.078 1435 1599
Most credible difference:
HDI
13,664 [5367, 22223]
5.63 [ 9.51, 20.9]
0.025 [0, 0.097]
406 [ 252, 1030]
1460 [1070, 1830]
Effect sizer 0.56 0.22 0.53 0.35 0.91
Most credible differences are given in bold.
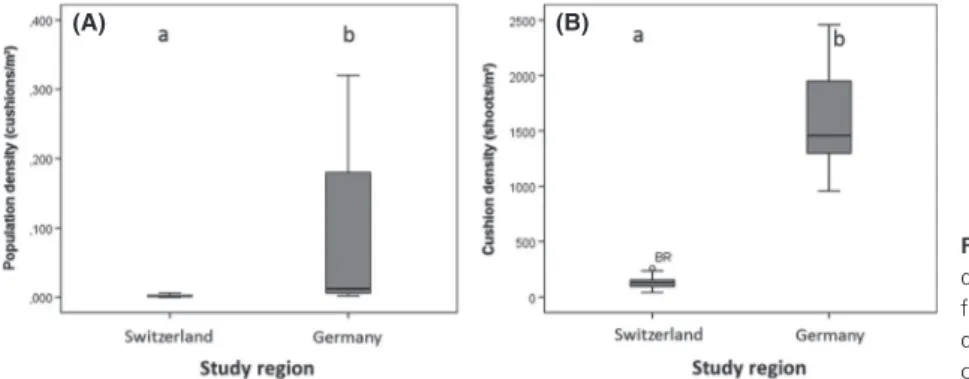
mean population density differed credibly (Fig. 2A) between Swiss and German populations (0.002 vs. 0.078 cushions per m²). In Switzerland, 0.0063–0.0001 cushions occurred per square meter compared to a variation between 0.0050 and 0.3200 cushions in Germany.
Mean cushion size did not differ credibly between Switzerland and Germany although cushions were smaller in Switzerland (1055 cm²) than in Germany (1435 cm²).
Generally the size of the cushions varied between 181 and 2017 cm². However, mean cushion density (Fig. 2B) of individuals from Switzerland (139 shoots per m²) was credibly lower than mean cushion density of individuals from Germany (1599 shoots per m²). In Swiss popula- tions, a density of maximal 263 shoots per m²was evalu- ated, which is in sharp contrast to the German populations consisting of at least 957 shoots per m² (Table 2).
Reproductive traits
Our analyses revealed no credible differences in flower production (Table 3) between Swiss and German popula- tions. Moreover, the mean number of capsules developed out of flowers (3.07 vs. 3.71) was comparable in Swiss and German populations (Fig. 3A,B). Therefore, regions did not differ in fruit set. Seed germination seemed to be the lowest in the 22 HD group, which differed credibly from the 14 HD and the 14/22 D groups (cf. lowercase letters in Fig. 4). However, when contrasting germination between regions, no difference was apparent between Bavarian and Swiss populations (mean difference: 7%, HDI: [ 0.09, 0.24]).
Molecular analyses
AFLP analysis resulted in 308 fragments. Genetic variation within populations (Table 3) was comparable in Switzer- land and Germany. Percentage of polymorphic bands ran- ged from 34.09% to 52.92% in Swiss populations and from 27.27% to 51.62% in German populations. Mean
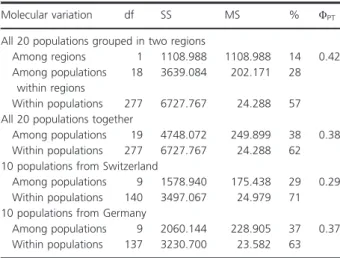
values for polymorphic loci, Shannon’s Information Index, and Nei’s gene diversity were comparable between both regions. An overall analysis of molecular variance (AMOVA) revealed 14% of variation among Switzerland and Germany, 28% among populations within regions and 57% within populations (Table 4) with ΦPT =0.42.
In a two-level AMOVA considering all populations, we observed 38% of variation among all populations and 62% within populations. Separate two-level analyses for Switzerland and Germany resulted in a slightly higher similarity among Swiss populations (ΦPT =0.29) than among German populations (ΦPT =0.37). A mantel test revealed no significant correlation of genetic and geo- graphic distances between populations in Switzerland (Fig. 5A), but a highly significant correlation (r=0.9098, P= 0.004) in Germany (Fig. 5B).
Correlation analyses
Generally, we observed in all analyses (Table 5) a signifi- cant correlation between habitat area and populations density as well as between the three measurements of genetic variation (Nei’s gene diversity, Shannon’s Infor- mation Index, and percentage of polymorphic loci). This is, however, not unexpected, as these values are based on the same raw data.
Considering all populations from both study regions (Table 5), we observed significant positive correlations between number of individuals and cushion size (q=0.518), population density and cushion size (q=0.461), as well as population density and cushion density (q= 0.645). Moreover, there was a positive corre- lation between number of flowers and population density (q=0.455), number of capsules and number of individu- als (q=0.486), and number of flowers and number of capsules (q= 0.636). We also observed a negative correla- tion between habitat area and cushion density (q= 0.544). Finally, genetic variation (%PL) was posi- tively correlated with habitat area (q=0.571) and nega- tively with population density (q= 0.464). This means
(A) (B)
Figure 2. Population density and cushion density ofD. gratianopolitanusof populations from Switzerland and Germany with significant differences: (A) population density and (B) cushion density.
that cushions are larger and denser in larger and denser populations and that more flowers and capsules are produced in denser populations. Genetic variation was, however, higher in populations colonizing a larger habitat area with a lower density.
If we analyzed the two regions separately (Table 5), we found less significant correlations. In Swiss populations, cushion size correlated negatively with cushion density (q= 0.818). Furthermore, we observed positive correla- tions between number of individuals and number of flow-
ers (q=0.829), number of individuals and number of capsules (q =0.856), as well as between number of flow- ers and number of capsules (q= 0.957). Genetic variation within Swiss populations was, however, not correlated sig- nificantly with any of the population structure parameters or reproductive traits. This means that large cushions were less dense in Switzerland and that more flowers and capsules were produced in larger populations.
In German populations (Table 5), we observed no sig- nificant correlation between population structure parame-
Table 3. Reproductive traits and genetic variation of all investigated populations ofD. gratianopolitanus. Mean values for the study regions and results of the statistical analysis are given. (NF, number of flowers; NC, number of capsules; FS, fruit set; He, Nei’s gene diversity; I, Shannon Index;
% PL, percentage of polymorphic loci).
N. Abbr. Population NF NC FS He I % PL
Switzerland
1 LC Le Chasseron 26.67 14.27 0.54 0.141 0.217 48.38
2 CR Col de Roches 0.07 0.00 0.00 0.093 0.144 34.09
3 CF Chr€uzflue 4.40 0.53 0.12 0.146 0.223 46.75
4 BK Balmfluech€opfli 0.13 0.00 0.00 0.152 0.235 52.92
5 RF Ravellen 5.40 0.60 0.11 0.130 0.200 43.18
6 BR Br€anten 1.67 0.00 0.00 0.149 0.228 49.35
7 HF Holzflue 8.07 0.80 0.10 0.139 0.216 48.70
8 GE Geissflue 1.20 0.00 0.00 0.154 0.236 50.65
9 FB Ruine Froburg 27.27 11.67 0.43 0.146 0.222 46.10
10 SF S€aliflue 10.67 2.80 0.26 0.143 0.220 48.38
Mean 8.55 3.07 0.36 0.139 0.206 46.85
Germany
11 SL Schwedenleite 22.80 5.40 0.24 0.156 0.234 45.78
12 FL Fischleiten 46.67 14.60 0.31 0.153 0.233 48.05
13 RK Rosskopf 23.67 9.07 0.38 0.141 0.211 40.91
14 KF Kachelfels 11.20 2.80 0.25 0.167 0.249 47.40
15 FH Falkenhorst 10.13 1.80 0.18 0.165 0.251 51.62
16 SE Schleuse 5.80 1.20 0.21 0.152 0.233 50.65
17 SB Steinerbr€uckl 5.33 1.83 0.34 0.134 0.200 38.64
18 GB Grain am Berg 50.20 0.00 0.00 0.155 0.230 42.86
19 AC Achtel 31.33 0.40 0.01 0.119 0.174 30.84
20 GF Grundfelsen 0.87 0.00 0.00 0.107 0.157 27.27
Mean 20.80 3.71 0.18 0.145 0.217 42.40
Most credible difference:
HDI
12.5 [ 3.18, 27.9]
0.24 [ 0.99, 3.46]
0.04 [0.23, 0.11]
0.005
[ 0.013, 0.024]
0.004
[ 0.028, 0.031]
4.47 [ 11.9, 2.51]
Effect sizer 0.41 0.19 0.16 0.14 0.07 0.33
(A) (B)
Figure 3. Number of flowers and capsules of D. gratianopolitanusof populations from Switzerland and Germany: (A) number of flowers and (B) capsules.
ters and reproductive traits. Genetic variation (%PL) was, however, correlated significantly positive with habitat area (q=0.632) and number of individuals (q=0.726), which means that larger populations exhibited higher genetic variation.
Discussion
In the study presented here, we analyzed the impact of isolation on the population structure, reproduction, and
genetic variation of the rare plant species D. gratianopoli- tanus. In contrast to our assumptions, population density was higher in Germany, although the magnitude of isola- tion was higher in this study region. This supports the findings of a previous study onHornungia petraea(Kluth and Bruelheide 2005), which also reported higher density in isolated peripheral populations. However, in a study on Cirsium acaule and C. heterophyllum (Jump and Woodward 2003), lower population density was found in more isolated populations. One reason for these differing observations may be the environmental conditions in the study regions. The magnitude of population isolation is indeed higher in Germany than in Switzerland, which supports the assumption that populations of a species become progressively less frequent and more spatially iso- lated approaching the edge of a species’ range (Lawton 1993; Sagarin and Gaines 2002; Sagarin et al. 2006). How- ever, environmental conditions must not necessarily get less suitable with increasing isolation. Under benign con- ditions, population density may increase despite increas- ing isolation. These conditions could also be the reason why we found higher cushion density in more isolated populations. Individual growth rate and, therefore, the number of shoots per square meter may be higher under suitable ecological conditions.
Increased population and cushion density affect growth and flowering traits (Hooftman et al. 2003) and are, for this reason, of particular interest for the reproduction of a plant species. Small and less dense populations often suffer from reduced pollinator activity (Honnay and Jac- quemyn 2007) and exhibit decreased levels of fitness (Leimu et al. 2006). Increased population and cushion density may, therefore, explain why we observed no dif- ferences in reproductive traits between the two regions with a different magnitude of isolation. There was even a trend for higher flower production in the region with a higher magnitude of isolation, although it must be taken into account that we analyzed flower production only in one vegetation period. In a study on Succisa pratensis, similar observations were reported. In this survey, plants from more strongly isolated habitat islands also produced on average more flower heads and rosettes than plants from connected habitat islands (Hooftman et al. 2003).
However, the higher number of flowers in Germany may be well explained by the higher population density in this study region.
Although we expected a negative impact of stronger isolation on the reproduction of D. gratianopolitanus, similar germination rates were found in both analyzed study regions. It is already known that increased habitat fragmentation and the associated isolation may cause a decline in seed yield (Steffan-Dewenter and Tscharntke 1999). For Juniperus communis, the production of filled
Figure 4. Germination of D. gratianopolitanus per treatment and region on day 7. Bars depict the most credible values for germination according to the Bayesian model. White bars represent germination of seeds from the Bavarian populations, while gray bars represent seed germination in Swiss populations. Error bars show lower and upper limits of 95% highest density intervals. Lowercase letters indicate credibly nonzero differences between treatments.
Table 4. Summary of the conducted analyses of molecular variance (AMOVA) with the studied populations of D. gratianopolitanus. (df, degree of freedom; SS, sums of squares; MS, mean squares; %, per- centage of molecular variance;ΦPT, genetic variation). All results were verified withP<0.001.
Molecular variation df SS MS % ΦPT
All 20 populations grouped in two regions
Among regions 1 1108.988 1108.988 14 0.42 Among populations
within regions
18 3639.084 202.171 28 Within populations 277 6727.767 24.288 57 All 20 populations together
Among populations 19 4748.072 249.899 38 0.38 Within populations 277 6727.767 24.288 62 10 populations from Switzerland
Among populations 9 1578.940 175.438 29 0.29 Within populations 140 3497.067 24.979 71 10 populations from Germany
Among populations 9 2060.144 228.905 37 0.37 Within populations 137 3230.700 23.582 63
seeds declined toward the limits (Garcıa et al. 2000) and strongly isolated populations of Narthecium ossifragum produced more, but smaller seeds that failed to germinate (Tsaliki and Diekmann 2009). However, a study onLych- nis viscaria revealed no difference between more and less isolated populations (Lammi et al. 1999) and in a recent study on Draba aizoides, strongly isolated relict popula-
tions exhibited even higher germination rates than popu- lations from the center of the distribution range (Vogler and Reisch 2013). High population density and the broad pollinator spectrum of D. gratianopolitanus accompanied by a strong potential for long-distance pollination (Erhardt 1990) may guarantee an effective pollination and the production of fertile seeds with high germination
(A) (B)
Figure 5. Correlation of geographic and genetic distances between populations of D. gratianopolitanus(Mantel test) from (A) Switzerland and (B) Germany.
Table 5. Results of the Spearman correlation analyses for all studied populations and for the populations from both regions separately. Significant results are given in bold. (HA, habitat area in m²; NI, number of individuals; PD, population density in cushions per m²; CS, cushion size in cm²; CD, cushion density in shoots per m²; NF, number of flowers; NC, number of capsules; He, Nei’s gene diversity; I, Shannon Index; % PL, percent- age of polymorphic loci).
HA NI PD CS CD NF NC He I
20 populations from Switzerland and Germany
NI 0.181
PD 0.958** 0.010
CS 0.345 0.518* 0.461*
CD 0.544* 0.060 0.645** 0.164
NF 0.383 0.434 0.455* 0.239 0.438
NC 0.094 0.486* 0.164 0.191 0.146 0.636**
He 0.009 0.245 0.121 0.039 0.189 0.276 0.184
I 0.138 0.258 0.013 0.073 0.053 0.118 0.121 0.967**
%PL 0.571** 0.395 0.464* 0.109 0.313 0.156 0.036 0.586** 0.738**
10 populations from Switzerland
NI 0.165
PD 0.976** 0.055
CS 0.006 0.488 0.03
CD 0.091 0.311 0.139 0.818**
NF 0.224 0.829** 0.309 0.333 0.115
NC 0.131 0.856** 0.188 0.338 0.231 0.957**
He 0.018 0.294 0.012 0.377 0.237 0.182 0.358
I 0.006 0.305 0.018 0.394 0.273 0.212 0.381 0.997**
%PL 0.492 0.131 0.511 0.316 0.292 0.219 0.320 0.762* 0.766**
10 populations from Germany
NI 0.569
PD 0.866** 0.214
CS 0.024 0.506 0.328
CD 0.377 0.366 0.207 0.345
NF 0.134 0.262 0.267 0.018 0.442
NC 0.345 0.180 0.216 0.091 0.006 0.219
He 0.353 0.366 0.207 0.406 0.115 0.261 0.347
I 0.524 0.502 0.305 0.243 0.049 0.116 0.421 0.948**
%PL 0.632* 0.726* 0.328 0.127 0.261 0.103 0.359 0.770** 0.900**
Level of significance indicated by asterisks (**:p<0.01,*:p<0.05)
rates also under conditions of stronger isolation, as reported in our study here.
The level of genetic variation within populations of D.
gratianopolitanus was within the range observed for rare, perennial and outcrossing plant species (Reisch and Bern- hardt-R€omermann 2014). However, we observed no sig- nificant difference between the study regions, which means that higher isolation in Germany compared to Switzerland did not result in genetic depauperation. In a previous review, it was already demonstrated that rare species are less susceptible to the effects of fragmentation than common species (Honnay and Jacquemyn 2007), which supports the assumption that naturally isolated populations are affected to a lower extent by the negative consequences of isolation such as the loss of variation and inbreeding (Huenneke 1991). For a set of isolated alpine plant species, it has quite recently been demon- strated that natural fragmentation does not necessarily result in the loss of genetic variation (Kuss et al. 2008), which supports our results. In particular, postglacial recolonization processes can mask the impact of isolation on genetic variation, as they affect either demography or population genetic structure directly (Pfeifer et al. 2009).
In the case of D. gratianopolitanus, genetic variation within populations seems to be much more affected by population density and size than by isolation. We could show that genetic variation decreases with increasing pop- ulation density across all studied populations. This may be traced back to the equalizing effects of gene flow within populations, which should be stronger in dense populations. In the German study region with a higher magnitude of isolation, genetic variation within popula- tions depended furthermore on population size, which is already known as most important factor for genetic varia- tion within populations (Leimu et al. 2006). The lack of this relationship in the Swiss study region with a lower magnitude of isolation may be attributed to the gene flow between populations, which presumably buffers the effect of population size and generates higher levels of genetic variation also within smaller populations.
Genetic variation was higher between populations ofD.
gratianopolitanus in Germany than in Switzerland. More- over, a correlation of genetic and geographic distances occurred only between German but not between Swiss populations. It has been postulated that genetic drift is 2–
30 times higher in isolated peripheral populations (Vuce- tich and Waite 2003) and it is beyond all question that gene flow counteracts the effects of genetic drift (Slatkin 1987). The stronger isolation of German populations apparently restricts gene flow and seems to cause a more distinct pattern of geographic variation in this study region.
Based upon our results, it can be concluded that the isolation of naturally fragmented populations must not necessarily have a negative impact on population struc- ture, reproduction and genetic variation within popula- tions. However, genetic variation between populations increases with geographic isolation due to restricted gene flow. Isolated populations make, from this point of view, due to their genetic uniqueness an essential contribution to a species’ full evolutionary potential. The protection of isolated D. gratianopolitanus populations should, there- fore, be an integral part of the strategy to conserve this central European endemic plant species.
Acknowledgments
We would like to thank Peter Poschlod for his generous support; Petra Schitko for assistance in the laboratory;
Martin Scheuerer, Wolfgang Ahlmer, Richard Lehmaier, and the ZDSF for information about the locations; and the government of the Upper Palatinate for financial support.
Conflict of Interest
None declared.
References
Baskin, C. C., K. Thompson, and J. M. Baskin. 2006. Mistakes in germination ecology and how to avoid them. Seed Science Research 16:165–168.
Bonin, A., E. Belleman, P. B. Eidesen, F. Pompanon, C.
Brochmann, and P. Taberlet. 2004. How to track and assess genotyping errors in population genetic studies. Mol Ecol 13:3261–3273.
Bylebyl, K., P. Poschlod, and C. Reisch. 2008. Genetic variation ofEryngium campestreL. (Apiaceae) in Central Europe. Mol. Ecol. 17:3379–3388.
Chaloupecka, E., and J. Leps. 2004. Equivalence of competitor effects and tradeoff between vegetative multiplication and generative reproduction: case study withLychnis flos-cuculi andMyosotis nemorosa. Flora 199:157–167.
Dorken, M. E., and C. G. Eckert. 2001. Severely reduced sexual reproduction in northern populations of a clonal plant, Decodon verticillatus(Lythraceae). J. Ecol. 89:339–350.
Ellstrand, N. C., and D. R. Elam. 1993. Population genetic consequences of small population size: implications for plant conservation. Annu. Rev. Ecol. Syst. 24:
217–242.
Erhardt, A. 1990. Pollination ofDianthus gratianopolitanus (Caryophyllaceae). Plant Syst. Evol. 170:125–132.
Fahrig, L. 2003. Effects of habitat fragmentation on biodiversity. Annu. Rev. Ecol. Syst. 34:487–515.
Galeuchet, D. J., C. Perret, and M. Fischer. 2005. Microsatellite variation and structure of 28 populations of the common wetland plant,Lychnis flos-cuculiL., in a fragmented landscape. Mol. Ecol. 14:991–1000.
Garcıa, D., R. Zamora, J. M. Gomez, P. Jordano, and J. A.
Hodar. 2000. Geographical variation in seed production, predation, and abortion inJuniperus communisthroughout its range in Europe. J. Ecol. 88:436–446.
Hegi, G. 1986. llustrierte Flora von Mitteleuropa. Pteridophyta - Spermatophyta. Blackwell, Berlin.
Hensen, I., C. Kilian, V. Wagner, W. Durka, J. Pusch, and K.
Wesche. 2010. Low genetic variability and strong
differentiation among isolated populations of the rare steppe grassStipa capillataL. in Central Europe. Plant Biol.
12:526–536.
Honnay, O., and H. Jacquemyn. 2007. Susceptibility of common and rare species to the genetic consequences of habitat fragmentation. Conserv. Biol. 21:823–831.
Hooftman, D. A. P., M. van Kleunen, and M. Diemer. 2003.
Effects of habitat fragmentation on the fitness of two common wetland species,Carex davallianaandSuccisa pratensis. Oecologia (Heidelberg) 134:350–359.
Hooftman, D. A. P., R. Billeter, B. Schmid, and M. Diemer.
2004. Genetic effects of habitat fragmentation on common species of Swiss fen meadows. Conserv. Biol. 19:1043–1051.
Huenneke, L. F. 1991. Ecological implications of genetic variation in plant populations. Pp. 31–44inD. A. Falk and K. E. Holsinger, eds. Genetics and conservation of rare plants. Oxford Univ. Press, New York, NY.
Jacquemyn, H., K. Vandepitte, R. Brysa, O. Honnay, and I.
Roldan-Ruiz. 2007. Fitness variation and genetic diversity in small, remnant populations of the food deceptive orchid Orchis purpurea. Biol. Conserv. 139:203–210.
Jennersten, O. (ed.) 1988.Pollination in Dianthus deltoides (Caryophyllaceae): effects of habitat fragmentation on visitation and seed set.
de Jong, T., and P. G. L. Klinkhamer. 1994. Plant size and reproductive success through female and male function.
J. Ecol. 82:399–402.
Jump, A. S., and F. I. Woodward. 2003. Seed production and population density decline approaching the range edge of Cirsiumspecies. New Phytol. 160:349–358.
K€asermann, C. 1999.Dianthus gratianopolitanus. Merkbl€atter Artenschutz - Blutenpflanzen und Farne. Swiss Agency for€ the Environment, Forests and Landscape (SAEFL/BUWAL), Bern.
Kluth, C., and H. Bruelheide. 2005. Central and peripheral Hornungia petraeapopulations: patterns and dynamics.
J. Ecol. 93:584–595.
Kolb, A. 2005. Reduced reproductive success and offspring survival in fragmented populations of the forest herb Phyteuma spicatum. J. Ecol. 93:1226–1237.
Korneck, D., M. Schnittler, and I. Vollmer. 1996. Rote Liste der Farn- und Bl€utenpflanzen (Pteridophyta et
Spermatophyta) Deutschlands. Schriftenreihe fur€ Vegetationskunde 28:21–188.
Kruschke, J. K. 2015. Doing bayesian data analysis - a tutorial with R, JAGS, and Stan. Academic Press, Waltham.
Kuss, P., A. R. Pluess, H. H.Ǽgisdottir, and J. St€ocklin. 2008.
Spatial isolation and genetic differentiation in naturally fragmented plant populations of the Swiss Alps. J. Plant Ecol. 1:149–159.
Lammi, A., P. Siikam€aki, and K. Mustaj€arvi. 1999. Genetic diversity, population size, and fitness in central and peripheral populations of a rare plantLychnis viscaria.
Conserv. Biol. 13:1069–1078.
Lawton, J. H. 1993. Range, population abundance and conservation. Trends Ecol. Evol. 8:409–413.
Leimu, R., P. Mutikainen, J. Koricheva, and M. Fischer. 2006.
How general are positive relationships between plant population size, fitness and genetic variation. J. Ecol.
94:942–952.
Listl, D., and C. Reisch. 2014. Genetic variation ofSherardia arvensisL. - How land use and fragmentation affect an arable weed. Biochem. Syst. Ecol. 55:164–169.
Mantel, N. 1967. The detection of disease clustering and a generalized regression approach. Cancer Res. 27:
209–220.
Matthies, D., I. Br€auer, W. Maiboom, and T. Tscharntke.
2004. Population size and the risk of extinction: empirical evidence from rare plants. Oikos 105:481–488.
Meusel, H., E. J€ager, S. Rauschert, and E. Weinert. 1978.
Vergleichende Chorologie der zentraleurop€aischen Flora.
Gustav Fischer, Jena.
Ouborg, N. J., P. Vergeer, and C. Mix. 2006. The rough edges of the conservation genetics paradigm. J. Ecol. 94:1233–1248.
Peakall, R., and P. E. Smouse. 2001.GenalEx: Genetic Analysis in Excel. Australian National University. http://
www.anu.edu.au/BoZo/GenAlEx.
Pfeifer, M., B. Schatz, F. X. Pico, N. G. Passalacqua, M. F. Fay, P. D. Carey, et al. 2009. Phylogeography and genetic structure of the orchidHimanthoglossum hircinum(L.) Spreng. across its European central-marginal gradient. J.
Biogeogr. 36:2353–2365.
Plummer, M. 2003.JAGS: A program for analysis of Bayesian graphical models using Gibbs sampling.
R-Core-Team. 2013. R: a language and environment for statistical computing. R Foundation for Statistical Computing, Vienna, Austria.
Reisch, C. 2008. Glacial history ofSaxifraga paniculata (Saxifragaceae) - molecular biogeography of a disjunct arctic-alpine species in Europe and North America. Biol. J.
Linn. Soc. 93:385–398.
Reisch, C., and M. Bernhardt-R€omermann. 2014. The impact of study design and life history traits on genetic variation of plants determined with AFLPs. Plant Ecol. 215:1493–1511.
Reisch, C., and J. Kellermeier. 2007. Microscale variation in alpine grasslands: AFLPs reveal a high level of genotypic
diversity inPrimula minima(Primulaceae). Bot. J. Linn.
Soc. 155:549–556.
Rogers, S. O., and A. J. Bendich. 1994. Extraction of total cellular DNA from plants, algae and fungi. Pp. 1–8inS. B.
Gelvin and R. A. Schilperoort, eds. Plant molecular biology manual. Kluwer Academic Press, Dordrecht.
Sagarin, R. D., and S. D. Gaines. 2002. The ‘abundant centre’
distribution: to what extent is it a biogeographical rule?
Ecol. Lett. 5:137–147.
Sagarin, R. D., S. D. Gaines, and B. Gaylord. 2006. Moving beyond assumptions to understand abundance distributions across the ranges of species. Trends Ecol. Evol. 21:524–530.
Schleuning, M., M. Niggemann, U. Becker, and D. Matthies.
2009. Negative effects of habitat degradation and fragmentation on the declining grassland plantTrifolium montanum. Basic Appl. Ecol. 10:61–69.
Schmid, B., and D. Matthies. 1994. Seltenheit und Gef€ahrdung - populationsbiologische Grundlagen des Artenschutzes.
Naturwissenschaften 81:283–292.
Schmidt, K., and K. Jensen. 2000. Genetic structure and AFLP variation of remnant populations in the rare plant
Pedicularis palustris(Scrophulariaceae) and its relation to population size and reproductive components. Am. J. Bot.
87:678–689.
Silcock, J. L., and R. J. Fensham. 2014. Specialized and stranded: habitat and biogeographical history determine the rarity of plant species in a semi-arid mountain range.
J. Biogeogr. 41:2332–2343.
Slatkin, M. 1987. Gene flow and the geographic structure of natural populations. Science 236:787–792.
Stan-Development-Team. 2014. RStan: the R interface to Stan, Version 2.6.0. http://mc-stan.org/rstan.html
Steffan-Dewenter, I., and T. Tscharntke. 1999. Effects of habitat isolation on pollinator communities and sed set.
Oecologia 12:432–440.
Tsaliki, M., and M. Diekmann. 2009. Fitness and survival in fragmented populations of Narthecium ossifragumat the species’ range margin. Acta Oecologica 35:415– 421.
Vogler, F., and C. Reisch. 2013. Vital survivors: low genetic variation but high germination in glacial relict populations of the typical rock plantDraba aizoides. Biodivers. Conserv.
22:1301–1316.
Vucetich, J. A., and T. A. Waite. 2003. Spatial patterns of demography and genetic processes across the species’ range:
null hypotheses for landscape conservation genetics.
Conserv. Genet. 4:639–645.
Welk, E. 2002. Arealkundliche Analyse und Bewertung der Schutzrelevanz seltener und gef€ahrdeter Gef€asspflanzen Deutschlands. Schriftenreihe fur Vegetationskunde€ 37:1–337.
Yeh, F. C., and C. Layton. 1979. The organization of genetic variability in central and marginal populations of lodgepole pinePinus contortassp.latifolia. Can. J. Genet. Cytol.
21:487–503.