Research Collection
Journal Article
Tracking mass removal of portable laser ablation sampling by its acoustic response
Author(s):
Kradolfer, Stefan; Heutschi, Kurt; Koch, Joachim; Günther, Detlef Publication Date:
2021-05
Permanent Link:
https://doi.org/10.3929/ethz-b-000476161
Originally published in:
Spectrochimica Acta. Part B, Atomic Spectroscopy 179, http://doi.org/10.1016/j.sab.2021.106118
Rights / License:
Creative Commons Attribution-NonCommercial-NoDerivatives 4.0 International
This page was generated automatically upon download from the ETH Zurich Research Collection. For more
information please consult the Terms of use.
Spectrochimica Acta Part B: Atomic Spectroscopy 179 (2021) 106118
Available online 23 March 2021
0584-8547/© 2021 The Author(s). Published by Elsevier B.V. This is an open access article under the CC BY-NC-ND license
(http://creativecommons.org/licenses/by-nc-nd/4.0/).
Tracking mass removal of portable laser ablation sampling by its acoustic response
☆Stefan Kradolfer
a, Kurt Heutschi
b, Joachim Koch
a, Detlef Günther
a,*aD-CHAB, Vladimir-Prelog-Weg 1, ETH Zürich, Zürich, Switzerland
bLaboratory for Acoustics/Noise Control, Empa, Überlandstrasse 129, 8600 Dübendorf, Switzerland
A R T I C L E I N F O Keywords:
Portable laser ablation sampling Acoustic tracking
Field sampling Event level
A B S T R A C T
If the sample cannot be brought to the lab for sampling, then the sampling needs to be done at the sample location. The portable laser ablation (pLA) system is one of the candidates to address this challenge, as it is a powerful tool for field deployable sampling of solids with the benefits of laser based analysis methods. However, sampling in the field is not always as convenient as in a defined laboratory setting and requires a neat prior method development. In the field, the evaluation of the sampling performance is not straightforward with current hardware. During mass removal by (p)LA, an acoustic pressure wave is formed for every individual LA event. In order to track these signals, a directional microphone was integrated into the handheld pLA-module.
This allowed the monitoring of the acoustic signal close to the ablation site to count and quantify LA events from each individual pulse. In order to monitor mass removal and acoustic response quasi-simultaneously, the pLA sampling device was coupled to an ICPMS via a gas-exchange device (GED). Performance was investigated using various samples. Discrepancies were observed between samples with low and high ablation thresholds. For samples with low ablation thresholds, e.g. metals, the acoustic signal was mainly influenced by the laser fluence at the ablation site and not by the amount of mass removal. Comparatively, when ablating samples with high ablation thresholds, such as glasses and minerals, these variations were less pronounced, resulting in the observation of a linear relationship. Consequently, this allows the use of the acoustic energy as a measure of the amount of mass removal. In summary, results show that this approach enables a straightforward way to track all actual ablation events during on-site sampling and allows an instant evaluation of the ablation performance, thereby reducing unsuccessful sampling sessions.
1. Introduction
Since the development of light amplification by stimulated emission of radiation (lasers) and its predecessors in the late 1950s and early 60s [1–4], their potential for material processing and analysis has been explored [5–7]. As a consequence, lasers became an industrial tool in the following decades and has been used for numerous applications, including cutting, welding and engraving [8,9]. The underlying princi- ple relies on the interplay between the laser wavelength/energy/pulse duration (λ/E/Δt) and the material characteristics. Often, these settings are adjusted for so-called laser ablation (LA) [7,10], i.e., the controlled removal of substance. Exceeding the irradiance on a material- and the
wavelength-specific threshold value, solid samples undergo decompo- sition through the interaction with the high-irradiance laser (cw or pulsed). This results in a sequence of phase transitions from solid to liquid to gas/vapor and the expansion of a laser-induced plasma (LIP).
The ablated material then undergoes nucleation, condensation, particle- and agglomerate-formation in an approximate mean size range between 0.01 and 1 μm [11]. This process may last for several tens of micro- seconds, depending on the LA settings, material properties, and ambient pressure. LA has been intensively studied over the past few decades [7,10] and a growing interest in LA was triggered by its versatility in applications.
The formation of LIP allows the performance of spectroscopic
☆This article is published in a special honor issue dedicated to Richard E. Russo to commemorate his 70th. birthday, for his achievements in the fields of laser- material interaction, plasma modeling and evolution, surface analysis with lasers, and for his vision of what is needed and critical in future theoretical, instrumental and methodological development.
* Corresponding author.
E-mail address: detlef.guenther@sl.ethz.ch (D. Günther).
Contents lists available at ScienceDirect
Spectrochimica Acta Part B: Atomic Spectroscopy
journal homepage: www.elsevier.com/locate/sab
https://doi.org/10.1016/j.sab.2021.106118
Received 27 September 2020; Received in revised form 5 February 2021; Accepted 7 February 2021
measurements for either qualitative or (semi-)quantitative elemental information (concentrations) of the ablated material or examination of plasma emission specific characteristics, known as laser induced breakdown spectroscopy (LIBS) [12–16]. The atomized and excited species in the plasma plume can directly be analyzed according to their elemental composition using mass spectrometry in laser microprobe mass analyzer (LAMMA, or LA mass spectrometry (LAMS) nowadays) [17–20]. Light scattering and shadowgraphy allow the observation and study of the expansion and condensation processes in detail [21–23].
The generated aerosol can subsequently be analyzed for particle size distribution, elemental and isotopic composition offline by e.g. scanning electron microscopy (SEM) [24–26], or online including post-ionization by e.g. inductively coupled plasma in optical emission spectroscopy (ICP-OES) or mass spectrometry (ICP-MS) [27–31].
While most LIBS applications are performed under atmospheric conditions or under inert atmosphere such as nitrogen, argon or helium, conventional LA-ICPMS is performed under controlled and defined conditions, using gas-tight ablation cells flushed with a constant flow of aerosol carrier gas to ensure reproducibility. Most commonly, helium is chosen as carrier gas due to an increased dispersion of the ablated ma- terial [21], followed by an enhanced signal in the ICPMS and reduced fractionation effects for silicates [32]. Less than a decade ago, open ablation approaches (under ambient air) with an air-to‑argon gas ex- change device (GED) for the subsequent analysis with ICPMS [33–36]
and LA as a pure sampling tool (a portable laser ablation-system, pLA) [36–40] were introduced. The number of pLA-users is constantly increasing and one user meeting has recently been held [41]. This last method will be described in more detail in the experimental section as it was the technique used for this research. In comparison with conven- tional LA-ICPMS, pLA provides similar performance regarding mini- mally destructive sampling and quantification capabilities [42], in combination with the freedom of sampling in the field as an portable analytical device. By combining the pLA-system and the GED, a labo- ratory based LA unit with almost no restrictions concerning sample size, ablation orientation and analytical performance is created (pLA-GED- ICPMS) [36]. For acoustic measurements this combination is favorable using a relatively basic experimental setup to collect the maximum desired information concerning acoustics and the quantitative ablation amount.
1.1. Applications in atomic spectroscopy
Monitoring acoustic waves using pressure changes detected with microphones has been shown to not only provide insights into the LIP including fundamental properties such as plasma propagation dynamics [43] but also allows the measurement of differences in the total amount of material removed during LA. This has opened new routes for analytical strategies, namely the possibility of using it for signal normalization purposes [44,45]. The idea to use the acoustic feed-back during laser-induced evaporation as an alternative to an internal stan- dardization for a spectroscopic analysis was first described by Chen et al.
[46] (1988) in a proof of principle study and has been further developed in subsequent years [43,46–50]. In 1991, acoustic feed-back was first used to correct LA-ICPAES/OES signals for signal instability, pulse-to- pulse variation with an overall decrease in time [48]. In brief, the in- tensity of the acoustic signal amplitude recorded using the microphone is used like an internal standard. In the early stages of this approach claims were made regarding the applicability as an additional tool for normalizing the data with the possibility to overcome known challenges, e.g. to correct for different ablation rates between samples [50,51], matrix effects [52,53] or unsteady signal response [47]. A better un- derstanding of the physical background and implications on the gener- ated acoustic signals was obtained as well [43,54–56].
In recent years, the concept of acoustic feed-back has been revived [57], especially for LIBS applications, to gain additional information regarding the dynamics of plasma propagation [58] or as a monitor of
the amount of the ablated material [59]. Following a similar approach, photo-acoustic spectroscopy deals with the local (thermal) expansion of matter over the absorption of (laser) light; or for gases the forming pressure increase as a wave is recorded and quantified by a microphone [60,61].
1.2. Aim of this work
The general purpose of pLA is to analyze immobile or bulky objects such as archaeological artifacts or geological samples for their elemental/isotopic composition, including major, minor, and trace ele- ments, by sampling on-sight in the field [37,38,40]. This pLA system is a combination of quasi-nondestructive sampling of conventional LA in the laboratory with almost unlimited sampling capabilities which a portable analytical device can provide. In comparison with other portable devices for elemental analysis, such as portable LIBS and portable XRF-systems which generate the information in situ, it provides access to almost the entire periodic table [37], including isotopic information [38], while providing overall lower limits of detection thereby allowing access to ultra-trace elements.
Portability requires robust, lightweight and reliable hardware. The system used comprises a nanosecond laser (λ =532 nm), a fiber-based laser beam delivery system including a lens system to focus the laser, a camera for observation and an ablation cap with an integrated access channel for sampling. The ablated material was extracted using a membrane pump and collected by deposition on a filter material for the subsequent analysis in the lab [40]. The choice of the 532 nm as the laser wavelength was a compromise between the desire in LA for a high photon energy [31] and flexibility through the fiber guidance, as oppose to an optical table, for simple handling in the field. Consequently, the materials which are highly absorbing in the visible range, as e.g. metals, are relatively straightforward to be ablated; whereas the sampling of transparent, less absorbing materials, as e.g. glass and some minerals, can be more challenging [62]. No or unsteady ablation on rough surfaces is the usual consequence. As mentioned, the analysis is performed later, in the lab under controlled conditions; either by re-ablation (LA-ICPMS) or wet chemistry followed various other established techniques, such as ICPMS [37]. It is important to note that the handling of the technical setup is complex and requires an experienced operator for a steady ablation.
In this work, the acoustic signal emitted during ablation using the portable laser ablation (pLA-)system is tracked, characterized and applied for normalization purposes. The acoustic feedback is meant to be used as direct control of the quality of the ablation process with the possibility to correct and readjust the laser focus on the sample surface for continuous ablation. The triggered read-out of every fired laser pulse was matched with the additional acoustic information making it possible to count the actual ablation pulses and ensure that material removal is taking place. As previously mentioned, the acoustic signal should ideally correlate with the ablated mass of material and can therefore be used to gain qualitative information for the ablation of the individual pulses and maybe different materials. This should allow the estimation for the mass of collected material on-site during sampling and prevents empty filters and therefore fewer unsuccessful field trips.
Because in ICPMS the signal intensity is proportional to the sample amount; it should also correlate with the acoustic signal. Hence, for proof-of-principle studies, the pLA sampling device was used in a labo- ratory based arrangement combined with a gas exchange device (GED) coupled to the ICPMS resulting in the direct tracking of the ablation yield [36]. This configuration allows the study of the efficiency of the sampling process with the subsequent analysis [46].
1.3. Acoustic pressure waves
When analyzing the plasma expansion during the LA process in even greater detail, the propagation of supersonic shock wave can be studied
at the boundary layer of the LIP [43,49], which forms and detaches due to rapid expansion of material, followed by heating and compression of ambient gas (air). According to Chen et al., the shock wave consists of a thermal wave and a pressure wave, the latter being dominant [46]. The pressure wave degenerates into a (transient) sound wave front of reduced peak acoustic pressure and can be perceived by the human ear or measured using a engineered pressure sensor, e.g. a microphone [49,50,63,64]. It specifically monitors the acoustic pressure wave as the deviation of the membrane from its neutral position or in other words the frequency of the membrane’s oscillation can be measured elec- tronically and further quantified [49,65]. The acoustic pressure is related to the speed of the shock- or acoustic wave created during LA.
The intensity of the acoustic signal depends (next to the ablation part) primarily on two factors: (a) the distance between the LA site and the microphone, and (b) the gas medium and its (static) pressure [65]. It is not very sensitive to the actual sample dimensions, morphology or the mounting of the sample [46] but is significantly affected by the sur- rounding spatial conditions. Especially acoustic echoes from reflective media can cause additional or even interfering signals [56,59]. The ambient media, its density and the pressure conditions further define the LA behavior in terms of the shockwave formation and plasma plume expansion [9]. However, the LA process will differ depending upon the conditions under which it takes place, for example under vacuum, inert atmosphere or open atmosphere.
2. Experimental 2.1. Laboratory conditions
Experiments reported below were performed indoor under similar laboratory conditions (~22 ◦C, air pressure ~ 950 hPa (ranging 920–980 hPa, https://iacweb.ethz.ch/meteostation/hberg_meteo).
Low-level ambient acoustic noise from laboratory facilities, such as cooling fans or rotary pumps, was accepted and considered as close-to- real background, which might also occur in field measurements. Still, larger noise from the cooling fan of the laser system was reduced by moving it >1.5 m away from the LA site (length of the optical fiber) and, in addition, by putting a plastic shield in between.
2.2. Portable Laser Ablation (pLA-) system
All the laser ablation experiments were performed with the original, almost unaltered pLA system conceptualized by Glaus and co-workers [37,38,40]. For acoustic tracking of LA events minor modifications were made (v.i.). The laser source was an air-cooled diode pumped solid state (DPSS) Nd:YAG laser (Wedge HB 532, Bright Solutions SRL, Cura Carpignano, Italy) with an output wavelength of 532 nm; for details see Table 1. The laser radiation was guided through a tapered optical fiber (core diameter from 600 μm to 200 μm, SFT600TO200Y, Fiberguide Industries, Stirling, NJ, USA) to the LA handheld module (Glaus et al.
[38]). As in this arrangement the diameter of the fiber-outlet influences the spot-size on the sample, the spot-size was given as >53 μm (theo- retical calculation) [62] and not further changed. The laser was either operated stand-alone or triggered externally using a function generator (DG535, SRS Stanford Research Systems, USA). Single LA event were set
with frequencies ≤0.05 Hz including series from 1 up to 30 LA events, whereas frequencies of 1, 4, 10 or 50 Hz (as individually mentioned) refer to hole drilling analyses including 20 up to 308 counted LA events.
The corresponding calculated aspect ratios of the ablation craters did not exceed a value of 1 for the series including single LA events and 2 for the continuous ablation series. The lower compartment of this module was equipped with a cap adapted for the experiments described within this work (see: chap. 2.4 and Fig. 2). The system was used similarly as described by Burger et al. 2017 (see Fig. 1) [36].
2.3. Audio acquisition
The acoustic signals were recorded using a commercial microphone (BY-M1, Boya, Jiayz Photo Industrial., Ltd., Shenzhen, China). The analog-to-digital conversion was accomplished using a separate audio interface (Scarlett 2i4 2nd Gen., Focusrite plc, High Wycombe, UK). The technical details, the calibration for absolute pressure and the calcula- tion for the dynamic range are given in the SI chapter 2. Signals were acquired by the open-source software audacity (Version 2.3.0, https://www.audacityteam.org/) using a sampling frequency of 44.1 kHz, a signal depth of 32-bit float and adjustable gain setting provided by the audio interface (see SI table S2). Subsequent data reduction was carried out manually using the software audacity. Further data treat- ment, including Fourier analysis, and illustrations of data was performed using the open-source statistical software R (R i386–3.4.3, https://www.
r-project.org/) [66] with the help of additional packages (ggplot2) [67]
implemented in the Rstudio environment (Version 1.1.383, https ://www.rstudio.com/) [68].
2.4. Hardware modifications for acoustic tracking by the pLA-system The acoustic tracking of ablation events was intended to be applied to field measurements, such as in museums, archaeological sites etc., i.e.
rarely under laboratory conditions. Tracking in open environments is not trivial and possible background noise from ambient sound sources nearby must be considered. The collection of the ablated material either by deposition on a filter or by the direct transport into an ICPMS via a gas exchange device (GED, see Section 2.9.) is commonly done using a membrane pump connected with tubing, which also generates a (continuous) acoustic background.
To enable sensitive acoustic tracking of LA events, the cap of the pLA handheld module was equipped with a 3.0 cm-long acoustic waveguide which was used to holding the microphone. As shown in Fig. 2, the waveguide had a tapered shape, which made possible (i) efficient and low-background-noise transmission of sound towards the microphone1 and (ii) integration/attachment of the microphone with as little changes to the original design as possible. This resulted in an increased sensi- tivity and a lower background noise. For convenience, the cap was manufactured by 3D printing using ABS-polymer (Visijet M3 Crystal, 3D systems Inc., Rock Hill, South Carolina, USA). The cavity of the cap and the finite-length channel create resonances that introduce a frequency dependent amplification/attenuation of the microphone signal. The ef- fect of this filter process is consistently visible in the frequency domain of the acquired data (see Fig. 3) and has to be corrected.
2.5. Acoustic data
The acoustic data (sound pressure) represents the short-term varia- tion of the pressure with respect to the average ambient pressure in [Pa].
Consequently, the arithmetic mean over a sufficiently long time interval is always zero. Single shockwave events are described either in terms of their maximal amplitude (peak) or by the integration of the squared Table 1
Operation parameters for the pLA system.
Laser ablation parameters
Pulse length <1 ns
Repetition rate Internal trigger:10–100 Hz
External trigger: Arbitrary (0–100 Hz)
Laser energy (max.) 0.79 mJ
Spot size >53 μm (Theoretical calculation [62])
Fluence (max.) 35.8 J/cm2
LA mode Single hole drilling 1 Essentially, the design outlined above corresponds to an embedded (closed)
directional microphone.
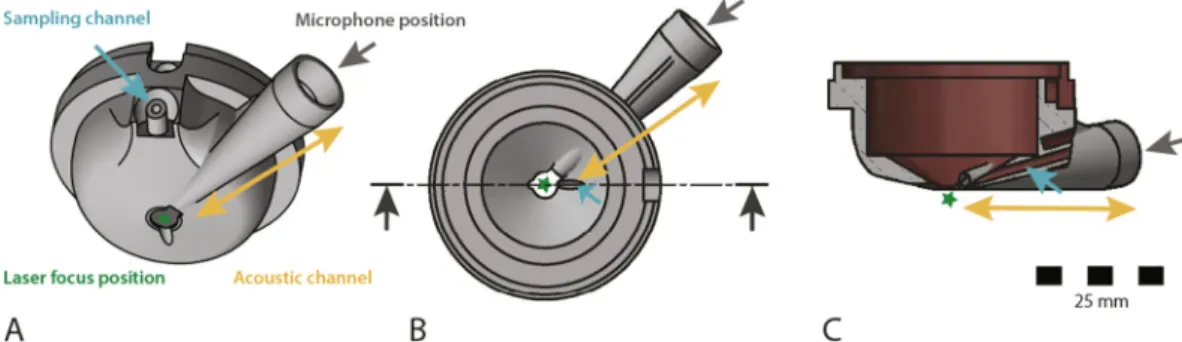
Fig. 1. Experimental setup allowing the online evaluation of the LA event generated by the pLA. The portable laser was externally triggered and guided via an optical fiber in the ablation-head. The laser was focused at the open end of the ablation cap where the acoustic signal can be tracked via the inserted acoustic channel and the microphone. The ablated material was sampled by a pump and transported through the GED (air-to‑argon) in the ICPMS.
Fig. 2. Technical drawing of the newly designed cap of the handheld module of the pLA system with the sampling channel (blue), the microphone position (grey), the position of the laser focus and the acoustic channel (yellow). The different views highlight the following: The ablation cap from the bottom (A), the top (B) and (C) a cross section, along the dashed line indicated in (B). (For interpretation of the references to colour in this figure legend, the reader is referred to the web version of this article.)
Fig. 3. Acoustic record of a single laser ablation event from the pLA-GED-ICPMS configuration for the ablation of pure Copper.
(A) Chronological representation of the periodic background noise (mainly from the pump), followed by a sudden, intense peak. The colored areas indicate the frames for the Fourier analysis of the background signal (light-blue) and the recorded signal of an ablation event (dark-blue). (B) Spectral represen- tation of the signals in the two sections indicated in A (back- ground, light blue and signal, dark-blue) obtained by Fourier transformation. The filled triangles indicate resonances (green) and anti-resonances (red) caused by the cavity and the shape of the acoustic channel. (C) The online signal of the directly coupled ICPMS on 63Cu is shown. The ablation event is set at 0.06 s (dark-blue dotted line) followed by delay of ca. 2 s and the ICPMS response with a washout of 20 s. (For interpretation of the references to colour in this figure legend, the reader is referred to the web version of this article.)
signal over a given time interval (see SI eq.-S2). If Figs. 3-A and 4-A are compared, the microphone response varied to an extent. In Fig. 3-A, the ablation event appears as a sharp discontinuity followed by a fast oscillation. Whereas in Fig. 4-A, a different ablation event generated a sharp discontinuity followed by an acoustic beat with a weakly damped oscillation. The differences result from the complex interplay of the sound generation mechanism, the overall spatial settings and the hard- ware response but cannot be predicted. Consequently, the favored and more robust description of the events is the energy of the total signal (event level (EL), see SI eq.-S2).
The background signal, mostly originating from the attached pump, was stationary and mainly concentrated in the lower frequency range (See Fig. 3). Reduction of the background noise was achieved via a band pass filter in the frequency domain of the individual signal. Followed by a FFT, all the frequency components in the raw signal between 100 and 1500 Hz were attenuated by a factor of 1000 prior to the evaluation of the ablation signal. The actual filter range was determined empirically.
This resulted in a much lower background noise level while keeping most of the signal information intact (See Figs. 3 and 4). The filter reduced the mean background pressure by a factor of 6.2 from 1.99 ± 0.27 Pa to 0.32 ±0.07 Pa, whereas the maximal amplitude of the in- dividual signal on average was reduced by a factor of only 1.2. All the given pressure values for the event levels were reported after the described filter process, if not otherwise indicated.
For the investigations in single laser ablation events, all the data for the first three pulses during one measurement series where not used due to a very large signal offset for the ICPMS response compared to the following measurements. This agrees very well with the data acquisition in LA-ICPMS where the ICPMS response for the first pulses were significantly different from the following pulses with regards to intensity and fractionation [69,70].
For continuous ablation all the acoustic signals were used and no distinction between the individual LA were made. The counting of the individual LA-events was performed after filtering the signal. All events between the time of an LA event (based on the set laser frequency) and more than 5 times the SD of the preliminary measured background signal were considered to be actual events. The number of acoustic events, the sum of the maximal amplitudes [Pa] of the counted acoustic events and the background corrected event level over the total time of the individual experiments were compared.
2.6. Surface analysis using microscopy
The evaluation and characterization of the craters produced by pLA was carried out using confocal microscopy (Plu neox, Sensofar, Barce- lona, Spain) and optical microscopy (Olympus BX51, OLYMPUS, Tokio, Japan). The micrographs were further processed using the open-source- software gwyddion (Version 2.55, http://gwyddion.net/) [71]. The actual ablated mass was not determined, as the acquired images were not conclusive due to the general appearance of the ablation craters.
2.7. Elemental analysis using ICPMS
The aerosol formed by pLA was directly analyzed by ICPMS using a gas exchange device (GED) to connect the two systems, in short pLA- GED-ICPMS (see Fig. 1). Aerosol transport from the pLA handheld module towards GED and ICPMS was accomplished using Tygon tubing (3 mm inside diameter, 30 cm length). For this purpose, a membrane pump (NMS 020, KNF Neuberger AG, Balterswil, Switzerland) located between the handheld module and the GED was used. The GED exchanged the ambient air with argon in four parallel rods having a length of 50 cm, each equipped with a permeable membrane (pore size 70 nm, porosity 60%); details of the working principle can be found elsewhere [34,36]. The GED settings applied here were similar to those described by Burger et al. [36]/Tabersky et al. [34] and are given in Table 2. All ICPMS measurements were performed using a ICP-
quadrupole (Q)-MS (Agilent 7500cs, Agilent Technologies, Santa Clara, USA). The entire system was optimized using LA of a metal standard (MBH B26, see SI table S5) for signal stability and sensitivity. After acquisition, data were further processed (including graphical process- ing) with the statistical program R (v.s.).
Different standard reference materials, including pure metals, metal alloys, minerals and glass were analyzed (see SI table S5). The samples investigated were chosen according to their absorption properties, with copper/brass as samples having a comparably low ablation threshold, calcite/lithium tetra-borate having a comparably high ablation threshold and samples with an ablation threshold in-between, as NIST610 at the higher end and the iron rich mineral BCR-2G at the lower end. All ICP-(Q-)MS signals were background-corrected based on the prior acquired background signal and integrated either totally (sum of the total signal) or using a pre-defined acquisition time for further calculations.
3. Results
3.1. Model calculations
As a general proof of concept ab-initio model calculations including overall energy conservation were performed. For these calculations, no experimental data were used and the model is based on basic equations from the disciplines of shockwave formation, laser-matter-interaction and the theory of plume-expansion. The energy balance includes the initial energy provided by a laser pulse and the individual energy losses during the ablation process, which are mostly sample specific. The remaining energy was assumed to be convert to shockwave’s energy und could be used to calculate its intensity (see SI Chapter 1.1 for a detailed description). The calculations also allowed to estimate the mass removal and the acoustic pressure of the shockwave, for a given spot size. The fluence was altered by changing the laser spot size while keeping the energy fixed, which is close to the actual handling of the pLA-system.
The calculations were performed for pure Copper and could be adjusted for any kind of materials, see Fig. 5 (and Fig.S6/S7/S8 in the SI).
The results showed the acoustic energy decreases with decreasing fluence (or increasing spot size) whereas the mass removal passes through a maximum while increasing the spot size. This is given by the mutual interaction of the energy contributions within the model system.
Samples with a high absorbance and a limited optical penetration of the laser show a relatively constant and fluence-independent ablation rate for comparably high laser energies [72,73]. As a consequence LA with these settings and increasing laser spot size (out of focus) results in a lower acoustic energy and up to a certain point in a higher mass removal followed by a decrease. Operating close to the respective ablation threshold would allow to assume a constant correlation. The same argument is expected to be valid for samples with a comparably high ablation threshold, additionally as the range of the spot size for ablation is much smaller.
3.2. Acoustic response without LA
To distinguish between an actual ablation event and the possibility of forming a laser induced plasma (LIP) in air during the attempt to ablate material, experiments without a sample were performed. Theoretical calculations for the LIP in air for the current system showed a maximal energy density of 3–4.2⋅1010 W/cm2 at the focal point. Tambay et al.
[74], Davis et al. [75], Simeonsson et al. [76] and others [77] reported that the formation of an LIP occurs at an energy density of around 1⋅10 [10]-4⋅1011 W/cm2 under similar conditions, which supports the
possible formation of an LIP in air when using the current system.
Experimental data with the current setup did not show any acoustic or ICPMS response of laser induced plasma formation, either in free air (see
SI Fig. S1) or with a non-ablating sample such as calcite2 (see Fig. 6). In contrast, actual material removal by LA leads to an acoustic signal and ICPMS response, as can be observed in Figs. 6, 7 and S2 (SI). The abla- tion event appears as a pulse in the acoustic signal and sudden broad- band increase in power spectral density, as described previously in the experimental section. The representation of the acoustic data in a spectrogram, a visual representation of the spectrum of frequencies of a signal as it varies with time, helps to identify the single events. This is especially beneficial for low signal intensities. A low acoustic response with no corresponding ICPMS response, as displayed in Fig. 6, for the second ablation spot, can be explained by either a signal below the limit of detection, a generally low abundance (absolute or isotopic) or insufficient mass transport to the ICPMS. Outgassing under the absorp- tion of the laser light translating to heat was not observed for the sam- ples investigated but cannot be excluded for other types of samples.
Matrices which are highly absorbing in the designated wavelengths, such as water rich tissue samples or similar, may show no ablation but loss of e.g. water under the exposure of a (pulsed) laser. This energy transfer can be tracked acoustically, as successfully demonstrated in optoacoustic tracking [60,61], but the effect is much smaller than the LIP which was the subject of investigation in this work.
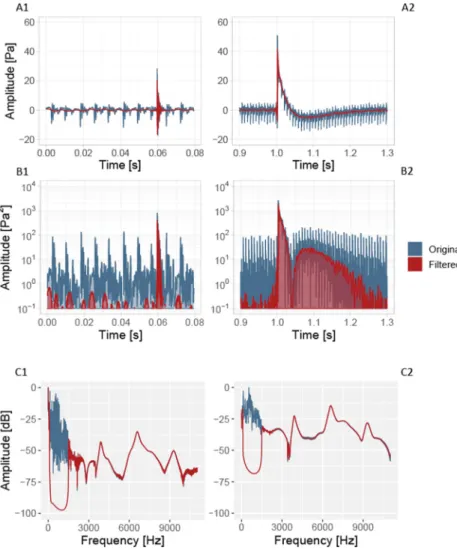
Fig. 4.Acoustic response of a single laser ablation event of pure copper using the pLA-system before (blue) and after (red) the application of a band pass filter (100–1500 Hz). (A) Overlay of filtered and un-filtered signals in the time domain.
The actual ablation event occurred approximately at 0.06 s (A1) and lasted for 0.003 s or at 1.0 s (A1) for 0.3 s. (B):
Overlay of the squared filtered and un-filtered responses in the time domain as a visual approximation for the Event level calculation. Data were plotted on log scale for a better com- parison of respective noise levels. (C): FFT frequency spectra of signals shown in panel (A). Notably, band-pass filtering enabled the suppression of low/mid-frequency noise by three orders of magnitude without compromising relevant spectral information of the LA-signal. The more intense peak in A2/B2 shows an overall higher frequency response for C2 compared to C1. (For interpretation of the references to colour in this figure legend, the reader is referred to the web version of this article.)
Table 2
Operating parameters for the pLA-GED-ICPMS setup.
GED-ICPMS
Gas exchange device – Q4 Pump 0.6–0.9 l min−1
Sweep Gas 14 l min−1 (4 ×3.5 l min−1) Warm-up time Minimum 1.5 h
ICP-(Q-)MS parameters RF-power 1350 W Sample depth 4.0 mm Carrier Gas 0.4 l min−1 Auxiliary gas 0.9 l min−1 Plasma gas 15 l min−1 Dwell time 10 ms
Detector mode Dual (pulse counting and analog) Isotope
selection Individual for different samples
Metals/alloys (copper, brass): 27Al, 29Si, 55Mn, 57Fe, 59Co, 60Ni,
63Cu, 65Cu, 66Zn, 75As, 40Ar38Ar, 107Ag, 111Cd, 118Sn, 121Sb, 125Te,
206, 207, 208Pb, 209Bi
Minerals/glasses: 23Na, 25Mg, 27Al, 29Si, 42Ca, 57Fe, 88Sr, 89Y, 137Ba,
139La, 140Ce, 141Pr, 146Nd, 147Sm, 153Eu, 157Gd, 159Tb, 163Dy, 165Ho,
166Er, 169Tm, 172Yb, 175Lu, 195Pt, 208Pb, 232Th, 238U
Calcite: 23Na, 25Mg, 27Al, 29Si, 44Ca, 88Sr, 89Y, 137Ba, 139La, 140Ce,
141Pr, 146Nd, 147Sm, 153Eu, 157Gd, 159Tb, 163Dy, 165Ho, 166Er,
169Tm, 172Yb, 175Lu, 195Pt, 206, 207, 208Pb, 232Th, 238U Quartz, Lithium tetra-borate: 7Li, 11B, 23Na, 24Mg, 27Al, 29Si
2 Low absorbing material for laser wavelength in the VIS-range, based on its optical properties [81].
3.3. Metal samples with a low ablation threshold (for 532 nm)
The design of the described setup made it especially suitable for applications performing sampling using LA on materials with low ablation thresholds in the VIS-spectra region, as e.g. metals.3[36,37,62]
The low ablation threshold in combination with the focused, high- energy laser always results in material removal and a corresponding acoustic response of the LIP can be tracked with the described setup (see Fig. 7).
The combination of the acoustic energy and the corresponding ICPMS response for these samples reveals an ambiguous picture (see Fig. 8). The first three pulses in all the respective drilling experiments are not taken into consideration for the discussion, as they are showing an overall high variation and deviations in signal intensity compared to latter events. The deviations are present for both responses, the acoustic- and ICPMS-signal, and do not follow an obvious trend. This may likely be explained by surface effects like changing reflectivity or surface roughness, as shown already for conventional LA-ICPMS [69,70]. The
response of the subsequent ablation events (≥4) is generally following the expected trend, given as continuous decrease in signal intensity with deeper ablation craters, again with respect to the acoustic- and ICPMS- signal. The individual measurement series of separated single laser ablation events show the expected grouping or a linear relation but the inter-series comparison shows shifts in between the different measure- ment series. The described pLA-hardware is limited in its accuracy concerning the focal position given by: its simplicity, the manual handling, limited capabilities for the observation and the short focal length of the main lens. Small changes in the handling can result in changes of the laser spot dimension because of the comparably short focal length of the system. For these conducting samples, the applied fluence was multiple times higher than the ablation threshold.
An additional phenomenon which may have been observed during these experiments is the so called plasma shielding [9]. Plasma shielding is characterized by the absorption of laser energy by the LIP leading to an increased ionization of different species, which subsequently results in a higher temperature, and vice versa. A higher gradient in the thermal wave generates a more intense pressure wave. The time range of the whole ablation process is long enough for plasma shielding to occur and has been shown to be an essential parameter for LA or LIBS applications [78,79]. Visualization of LA aerosols with the focus of the laser above, at or below the target demonstrate differences in shockwave formation and expansion [21,22,80]. These differences could have an additional in- fluence on tracking the acoustic measurement through alteration of the hemispherical expansion.
The triangular spread in Fig. 8 illustrates all the previously discussed factors regarding the formation for of the acoustic pressure wave. An increase in laser energy results in a higher acoustic energy but not necessarily in more mass removal. An increase in spot size may result in more mass removal but is not following to the same extent with a higher acoustic energy. At this stage a clear distinction between them cannot be done. To keep these effects separate and experimentally verify them would be an important issue for future research. But taking them in consideration would indicate that the simple assumption of the positive, linear relation between the sample removal and the acoustic energy does not apply for fluences much higher than the sample dependent ablation threshold.
We assume, in this regime the acoustic energy is mainly influenced by the additional energy absorption of the plasma during the ablation.
Tracking the acoustic response assists in this regard finding the optimum focal point position by indicating the most intense acoustic signal for the smallest spot size. A rough estimation of the removed mass is possible based solely on the number of ablation events, as done hitherto. None- theless, a major benefit of the acoustic tracking is the possibility to track the exact number of LA-events.
3.4. Low absorbing materials, i.e. NIST glasses or selected minerals Low VIS-absorbing, non-conducting samples have a higher material specific threshold fluence for LA. The distinct features of pLA concerning its portability are restrictive in this regards [62], in contrast to con- ventional LA-ICPMS. Indeed, samples under investigation have to be exactly in focus of the objective-lens to allow for material removal by LA (see section above). Additionally, continuous ablation was difficult to achieve.
The investigation of distinct single ablation events is therefore very challenging and not applicable here. Instead, continuous (with possibly random) ablation with a laser frequency of 10 Hz was chosen. In this regards, acoustic investigations allowed the tracking of unsteady abla- tion (see SI Fig. S3) and provided a picture during the whole ablation series.
As mentioned in the introduction, the settings of relatively close energies of the laser and the sample specific ablation threshold allow the assumption of a linear relation between the amount of ablation and acoustic energy. The results discussed above challenges it for highly Fig. 5. The visualization of the model calculation describing the LA with an
approach including energy conservation. Initial parameters about the laser source, e.g. energy (here fixed to E0 = 0.5 mJ), and the samples allow to calculate the corresponding acoustic shockwave pressure [Pa] (A) and the mass removal [g] (B) in regard to a changing spot-size, which is directly transferable to fluence. The dotted red line is indicating the minimal rspot for the pLA- System. The pressure is decreasing with the fluence, whereas the mass removal is going through a maximum (red cross). (For interpretation of the references to colour in this figure legend, the reader is referred to the web version of this article.)
3 Conducting materials with an easily accessible conduction band and therefor a lot of free electrons can absorb the laser energy very efficiently. The actual ablation threshold is therefore comparably low and the penetration depth is small given by the short path of total absorption. Additional laser energy does not translate in a linear increase in material removal. An ablation rate of roughly 10–100 nm and lower in comparison to semiconducting or insulating materials can be expected.
conducting materials and fluences much above the ablation threshold.
The differently assessed acoustic parameters, namely the number of pulses, the sum of their maximal amplitude and the event level of the total signal (see SI eq.-S2), and the relationship for all the measurement series of the two samples BCR-2G and NIST SRM 610 are shown in the SI Fig. S4. In contrast to the studies on the single ablation events, the first
few pulses were deliberately included in the evaluation. The data is consistent with the expectation that an increase in the counted LA- events directly result in higher numbers for the sum of the (maximal) amplitudes and the Event Level (EL). The values for higher numbers of LA-events additionally average out the influence of the first few pulses, general signal variations and reduce the spread of the data. Additionally, Fig. 6.The ablation of Calcite with a laser frequency of 0.025 Hz (19.0 J/cm2) is shown: (A) The acoustic record of the ablation with the raw signal in dark-blue and the (band-pass) filtered signal in red is shown. The laser trigger is indicated by an orange line. (B1-3) Spectrogram of the zoomed area of LA event number 1 (B-1), 2 (B-2) and 3 (B-2) of (A) is shown for better observation of possible elevated frequencies. (C) The measured ICPMS response on the mass channel of 44Ca is shown. For the first LA event a response in both, the spectro- gram and the ICPMS response, is visible. The 2nd LA is already hardly recognizable in the spectrogram and no MS-signal was recorded. All further LA events show no response on both channels. (For interpretation of the references to colour in this figure legend, the reader is referred to the web version of this article.)
Fig. 7. Tracking of a single ablation event (A/B/C-1) and a series of ablation events (A/B/C-2) from a brass sample using pLA-GED-ICPMS is shown. (A): The acoustic record of the ablation with the raw signal in dark-blue and the (band-pass) filtered signal in red is shown over time. The laser trigger is indicated by an orange line. (B) The spectrogram of the acoustic signal with the amplitude, given with a colour gradient, allows the location of the individual LA- events similar as shown in (A), for single events (B- 1) and series (B-2). (C) The measured ICPMS response shows the signal on the mass channel of 63Cu. The delay between the laser trigger and the MS-response is given by the duration of the aerosol transport from the ablation site through the GED through the ICP and to the detector. (For interpretation of the references to colour in this figure legend, the reader is referred to the web version of this article.)
for acquisitions including a low number of LA-events in a relatively long measurement period the contribution of discontinuous background ar- tifacts especially influences the EL. This explains the spread on the lower end of the data set for the plots including the EL.
In Figs. 9 and 10 the acoustic signal as counted LA pulses [#], the running total of the actual amplitude of the counted LA pulses [Pa] and the EL [dB] vs. the ICPMS response for the three isotopes is displayed, for BCR-2G in Fig. 9 and NIST SRM 610 in Fig. 10, respectively. The different data points represent individual measurements series including from 20 up to 308 counted LA events. The isotopes represent main and trace elements. A linear regression model was fitted to the data to evaluate the linearity of the system. An increase of the R2-value towards 1.0 (as a measure of accuracy) is given for the sum of the amplitude and for the EL for both measurement series. This trend supports the assumption that an increased number of LA-events leads to more sample removal and resulting higher ICPMS response. Although the linear trend is reproducible, the different daily performance of ICPMS does not allow for a direct comparison of the daily achieved intensity (Figs. 9 and 10).
Nonetheless similar slopes in log-log-representation indicate a constant ratio between mass removal and acoustic signal, even though they are not on the same absolute level.
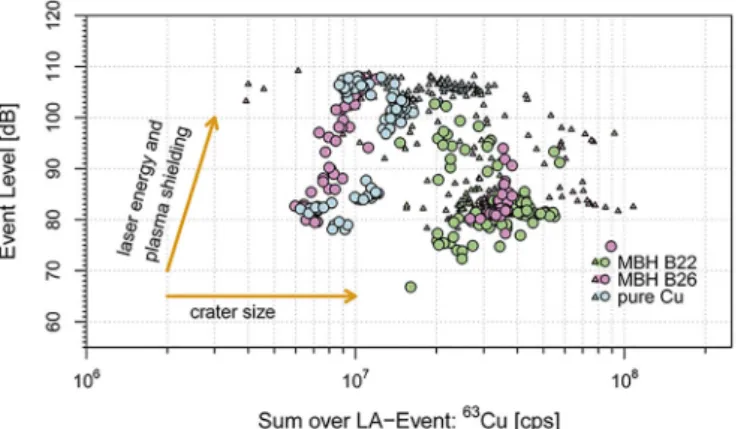
The dark, iron rich mineral BCR-2G (Fig. 9) has a relatively steady ablation if in perfect focus and the data is consistent in the respective measurement sessions. The slopes of the linear fits do not fully align but still describe the same trend. For the glass matrix (NIST SRM 610) the ablation is less steady (see Fig. 10) and variations in the signal (acoustic and ICPMS) are therefore more pronounced. But the slopes of the linear fits follow the stated trend and the data presents a consistent picture. It should be noted that an estimation of the actual mass removal presents to be more accurate when using the sum of the amplitude or the EL rather than the pure count of LA-events, as proposed and discussed in the Fig. 8. Sum of the ICPMS-response [cps] on 63Cu for single pLA events vs. the
measured EL [dB]. Results from the three different Copper and Brass standards, pure Copper (blue), MBH B26 (violet) and MBH B26 (green) are shown. The ICPMS-signal was corrected for the respective isotopic abundance in the sam- ple. The triangular shaped data points represent the first three LA events in the respective drilling experiments (up to maximal 30). They are showing de- viations in signal intensity compared to latter events, as shown in conventional LA-ICPMS, and are therefore not taken into consideration for the data evalua- tion and discussion. The data is fanning out for increasing values of both axes.
The overall trend and spread of the data can be explained with the fluence dependent acoustic signal, mostly influenced by changes in laser energy and including plasma shielding. An increase in crater size results in more mass removal which is less fluence dependent for the ablation process on these conducting metal samples. (For interpretation of the references to colour in this figure legend, the reader is referred to the web version of this article.)
Fig. 9. Comparison of replicate measurements (green, dark-green) for the iron rich mineral BCR-2G: Correlation of the ICPMS response for a running sum of three isotopes (29Si, 57Fe, 140Ce) vs. the acoustic response, including the number of counted events (>5σ of prior background), the running sum of their amplitude [Pa] and the EL over the total track [dB], similar to Fig. 8 A/B/C-2. Each data point represents a series of consecutively LA events (10 Hz) for two different measurement sessions (green, dark-green). The lines indicate a linear best fit for two individual sessions. For a better visualization all the individual plots are in a log-log-plot representation (the dB-scale is a logarithmic itself), where a linear fit still appears linear. (For interpretation of the references to colour in this figure legend, the reader is referred to the web version of this article.)
experimental section.
Most important, the use of the acoustic signal for this kind of sam- ples, with especially low ablation thresholds, allows in any case count- ing all the actual LA events thereby giving a good estimation of the total mass removal.
4. Conclusion
The correlation of the ablation rate of various samples with the acoustic signal created during the corresponding LIP formation was investigated. The combination of pLA-GED-ICPMS with a microphone provides the possibility of performing laser ablation sampling while allowing the monitoring of the relative mass removal. With the current system, LA in air or of non-ablating samples does not lead to the for- mation of a laser induced plasma and therefore does not produce an acoustic signal. According to the experiments, material removal through LA consistently creates an acoustic signal. The acoustic response can be measured continuously and allows the count of the LA events on an individual level for various samples. Constant background noise can be reduced using a band-pass filter in the lower frequency range. This en- ables the distinction of even less intense ablation events from the remaining background.
Samples with a relatively low ablation threshold create intense acoustic signals but do not show a straight accessible correlation be- tween the acoustic signal and the ICPMS-response. Modell calculations show a decrease of acoustic energy with lower fluence whereas the mass removal passes through a maximum. The acoustic signal is proposed to be mainly dominated by plasma shielding effects and has been demon- strated to be an indication of the optimal focus position, as done hitherto.
For samples with a relatively high ablation threshold, this effect is less pronounced as the maximal reachable fluence on the LA-site is close to the ablation threshold. Consecutive multi pulse experiments show a linear relationship between the total acoustic signal and the sum of the ICPMS response. The most accurate description of the acoustic signal is the sum over the amplitude of the acoustic events or the event level (EL), given by an increase in the R2-value for an assumed linear relationship.
The mass removal rate for different sample matrices, measured by GED-ICPMS, could not be directly correlated via the acoustic energy.
Nevertheless, the main advantage of the proposed approach is the pos- sibility of counting and quantify the actual LA events during (a possibly unsteady) ablation on a field site. This parameter in combination with method developments, carried out earlier in the laboratory, can further be used as additional indicators for the total mass removal, next to the user’s experience. The possibility of insufficient sampling during a field trip can be avoided or at least be confirmed by evaluating the acoustic response during ablation.
Furthermore this study indicates that the intentional use of the relative acoustic energy is a valid measure for the adjustment of the laser focus for the optimal position, i.e. the smallest crater size. Manual ad- justments, as usually practiced, are not the optimal solution for re- focusing as that may be accompanied by minimal lateral movements which result in fraying of the crater. An automated approach with a direct real-time recording and corresponding feedback would be less failure-prone and more sensitive for changes, giving an overall better control.
Alternative tracking of the ablation and mass removal using the spectral analysis of the LIB, e.g. by LIBS, could be a different strategy, but may compromise the portable nature of the device. However, one must not lose sight of the applications for which the device was Fig. 10. Results for the reference material NIST SRM 610: Comparison of the ICPMS response for a running sum of three isotopes (29Si, 140Ce, 208Pb) against the acoustic response, including the number of counted events (>5σ of prior background), the running sum of their amplitude [Pa] and the EL over the total track [dB] is shown. Each data points represents a series of consecutively performed LA events (10 Hz) for two different measurement sessions (violet, dark-violet). The lines indicate a linear best fit for two sessions. The slopes adjust from the number of pulses to the sum of the maximal amplitude to the EL. For a better visualization all the individual plots are in a log-log-plot representation (the dB-scale is logarithmic itself), where a linear fit still appears linear. (For interpretation of the references to colour in this figure legend, the reader is referred to the web version of this article.)
originally designed for; Sampling artefacts in the field with the benefits of a laser-based approach.
Declaration of Competing Interest
The authors declare that they have no known competing financial interests or personal relationships that could have appeared to influence the work reported in this paper.
Acknowledgement
This article is in honor of the lifetime achievements of Prof. Dr.
Richard E. Russo in spectrochemistry and especially in the field of fun- damentals in laser ablation and LIBS. A number of successful applica- tions of our research group is based on the pioneered fundamental research by Rick Russo and his team and we enjoyed this fruitful ex- change of experience over more than two decades, including approxi- mately twenty-five winter conferences on plasma spectrochemistry.
Assistance through the mechanical workshop of D-CHAB, especially Roland Mader and Roland Walker, and financial (ETH Zurich) and ¨ infrastructure support (ETH Zurich, Empa Dübendorf) is greatly acknowledged. Scientific input and discussion with Dr. Lorenzo Querci and Dr. Lyndsey Hendriks are greatly acknowledged. An edit by Dr.
Henry Longerich, Memorial University of Newfoundland, Canada is also acknowledged.
Appendix A. Supplementary data
Supplementary data to this article can be found online at https://doi.
org/10.1016/j.sab.2021.106118.
References
[1] A.L. Schawlow, C.H. Townes, Infrared and optical masers, Phys. Rev. 112 (6) (1958) 1940.
[2] T.H. Maiman, Optical and microwave-optical experiments in ruby, Phys. Rev. Lett.
4 (11) (1960) 564–566, https://doi.org/10.1103/PhysRevLett.4.564.
[3] P.P. Sorokin, M.J. Stevenson, Stimulated infrared emission from trivalent uranium, Phys. Rev. Lett. 5 (12) (1960) 557–559, https://doi.org/10.1103/
PhysRevLett.5.557.
[4] C.K.N. Patel, Continuous-wave laser action on vibrational-rotational transitions of CO2, Phys. Rev. 136 (5A) (1964) 1187–1194, https://doi.org/10.1103/
PhysRev.136.A1187.
[5] F. Brech, W.J. Young, The laser microprobe and its application to the analysis of works of art, in: Application of Science in Examination of Works of Art.
Proceedings of the Seminar: September 7–16, 1965, Conducted by the Research Laboratory, Museum of Fine Arts, Boston, Massachusetts, 1965, pp. 230–237.
[6] K. Niemax, Laser Ablation for Microanalysis, in: Optoelectronics for Environmental Science, Springer, US, 1990, pp. 229–236, https://doi.org/10.1007/978-1-4684- 5895-4_20.
[7] R.E. Russo, Laser Ablation, Appl. Spectrosc. 49 (9) (1995) 14A–28A. Vol. 49, Issue 9, pp. 14A-28A.
[8] J. Hecht, A short history of laser development, Appl. Opt. 49 (25) (2010) F99–F122.
[9] D. B¨auerle, Laser Processign and Chemistry, 2011, https://doi.org/10.1007/978-3- 642-17613-5.
[10] R.E. Russo, X. Mao, S.S. Mao, The physics of laser ablation in microchemical analysis, Anal. Chem. (2002) 70 A–77 A, https://doi.org/10.1021/ac0219445.
American Chemical Society February.
[11] J. Koch, A. Von Bohlen, R. Hergenr¨oder, K. Niemax, Particle size distributions and compositions of aerosols produced by near-IR Femto- and nanosecond laser ablation of Brass, J. Anal. At. Spectrom. 19 (2) (2004) 267–272, https://doi.org/
10.1039/b310512a.
[12] F. Breech, L. Cross, Optical microemission stimulated by a ruby maser, Appl.
Spectrosc. 16 (59) (1962) 1.
[13] M. Baudelet, B.W. Smith, The first years of laser-induced breakdown spectroscopy, J. Anal. At. Spectrom. 28 (5) (2013) 624, https://doi.org/10.1039/c3ja50027f.
[14] J. Debras-Gu´edon, N. Liodec, De l’utilisation Du Faisceau d’un Amplificateur a Ondes Lumineuses Par ´Emission Induite de Rayonnement (Laser `a Rubis), Comme Source ´Energ´etique Pour l’excitation Des Spectres d’´emission Des El´´ements, CR Acad. Sci 257 (1963) 3336.
[15] L.J. Radziemski, From LASER to LIBS, the Path of Technology Development, Spectrochim. Acta - Part B Atomic Spectroscopy 57 (2002) 1109–1113, https://doi.
org/10.1016/S0584-8547(02)00052-6.
[16] R. Noll, Laser-induced breakdown spectroscopy, in: Laser-Induced Breakdown Spectroscopy, Springer Berlin Heidelberg, Berlin, Heidelberg, 2012, pp. 7–15, https://doi.org/10.1007/978-3-642-20668-9_2.
[17] N.C. Fenner, N.R. Daly, Laser used for mass analysis, Rev. Sci. Instrum. 37 (8) (1966) 1068–1070, https://doi.org/10.1063/1.1720410.
[18] F. Hillenkamp, E. Unsold, R. Kaufmann, R. Nitsche, A high-sensitivity laser ¨ microprobe mass analyzer, Appl. Phys. 8 (4) (1975) 341–348, https://doi.org/
10.1007/BF00898368.
[19] Q. Yu, L. Chen, R. Huang, W. Hang, B. Huang, W. Hang, J. He, Laser ionization time-of-flight mass spectrometry for direct elemental analysis, TrAC - Trend. Anal.
Chem. (2009) 1174–1185, https://doi.org/10.1016/j.trac.2009.07.006. Elsevier November 1.
[20] L. Querci, V. Varentsov, D. Günther, B. Hattendorf, An Rf-only ion funnel Interface for ion cooling in laser ablation time of flight mass spectrometry, Spectrochim.
Acta - Part B At. Spectrosc. 146 (2018) 57–68, https://doi.org/10.1016/j.
sab.2018.05.004.
[21] J. Koch, S. Schlamp, T. R¨osgen, D. Fliegel, D. Günther, Visualization of aerosol particles generated by near infrared Nano- and Femtosecond laser ablation, Spectrochim. Acta - Part B At. Spectrosc. 62 (1) (2007) 20–29, https://doi.org/
10.1016/j.sab.2006.11.006.
[22] J. Koch, M. W¨alle, S. Schlamp, T. R¨osgen, D. Günther, Expansion phenomena of aerosols generated by laser ablation under helium and argon atmosphere, Spectrochim. Acta - Part B At. Spectrosc. 63 (1) (2008) 37–41, https://doi.org/
10.1016/j.sab.2007.11.013.
[23] J. Koch, S. Heiroth, T. Lippert, D. Günther, Femtosecond laser ablation:
visualization of the aerosol formation process by light scattering and
Shadowgraphic imaging, Spectrochim. Acta - Part B At. Spectrosc. 65 (11) (2010) 943–949, https://doi.org/10.1016/j.sab.2010.09.004.
[24] R. Glaus, R. Kaegi, F. Krumeich, D. Günther, Phenomenological studies on structure and elemental composition of nanosecond and femtosecond laser-generated aerosols with implications on laser ablation inductively coupled plasma mass spectrometry, Spectrochim. Acta - Part B At. Spectrosc. 65 (9–10) (2010) 812–822, https://doi.org/10.1016/j.sab.2010.07.005.
[25] H.R. Kuhn, D. Günther, Elemental fractionation studies in laser ablation inductively coupled plasma mass spectrometry on laser-induced Brass aerosols, Anal. Chem. 75 (4) (2003) 747–753, https://doi.org/10.1021/ac0259919.
[26] M. Thompson, S. Chenery, L. Brett, Nature of particulate matter produced by laser ablation-implications for tandem analytical systems, J. Anal. At. Spectrom. 5 (1) (1990) 49–55, https://doi.org/10.1039/JA9900500049.
[27] M. Thompson, J.E. Coulter, F. Sieper, Laser ablation for the introduction of solid samples into an inductively coupled plasma for atomic-emission spectrometry, Analyst 106 (1258) (1981) 32–39, https://doi.org/10.1039/AN9810600032.
[28] C. Geertsen, A. Briand, F. Chartier, J.L. Lacour, P. Mauchien, S. Sj¨ostr¨om, J.
M. Mermet, Comparison between infrared and ultraviolet laser ablation at atmospheric pressure-implications for solid sampling inductively coupled plasma spectrometry, J. Anal. At. Spectrom. 9 (1) (1994) 17–22, https://doi.org/10.1039/
JA9940900017.
[29] A.L. Gray, Solid sample introduction by laser ablation for inductively coupled plasma source mass spectrometry, Analyst 110 (5) (1985) 551–556, https://doi.
org/10.1039/AN9851000551.
[30] R.E. Russo, X. Mao, J.J. Gonzalez, S.S. Mao, Femtosecond laser ablation ICP-MS, J. Anal. At. Spectrom. 17 (2002) 1072–1075, https://doi.org/10.1039/b202044k.
[31] D. Günther, R. Frischknecht, C.A. Heinrich, H.J. Kahlert, Capabilities of an argon fluoride 193 nm excimer laser for laser ablation inductively coupled plasma mass spectometry microanalysis of geological materials, J. Anal. At. Spectrom. 12 (9) (1997) 939–944, https://doi.org/10.1039/A701423F.
[32] S.M. Eggins, L.P.J. Kinsley, J.M.G. Shelley, Deposition and element fractionation processes during atmospheric pressure laser sampling for analysis by ICP-MS, Appl.
Surf. Sci. 127–129 (1998) 278–286, https://doi.org/10.1016/S0169-4332(97) 00643-0.
[33] K. Nishiguchi, K. Utani, D. Günther, M. Ohata, Gas to particle conversion-gas exchange technique for direct analysis of metal carbonyl gas by inductively coupled plasma mass spectrometry, Anal. Chem. 86 (20) (2014) 10025–10029, https://doi.org/10.1021/ac502168h.
[34] D. Tabersky, K. Nishiguchi, K. Utani, M. Ohata, R. Dietiker, M.B. Fricker, I.M. de Maddalena, J. Koch, D. Günther, Aerosol entrainment and a large-capacity gas exchange device (Q-GED) for laser ablation inductively coupled plasma mass spectrometry in atmospheric pressure air, J. Anal. At. Spectrom. 28 (6) (2013) 831, https://doi.org/10.1039/c3ja50044f.
[35] D. Tabersky, Fundamental and Applied Studies on Large and Heterogeneous Samples Using LA-ICP-MS under Atmospheric Pressure Air, ETH Zürich, 2014, https://doi.org/10.3929/ethz-a-010378862.
[36] M. Burger, R. Glaus, V. Hubert, S. van Willigen, M. Worle-Soares, F. Convertini, ¨ P. Lefranc, E. Nielsen, D. Günther, Novel sampling techniques for trace element quantification in ancient copper artifacts using laser ablation inductively coupled plasma mass spectrometry, J. Archaeol. Sci. 82 (2017) 62–71, https://doi.org/
10.1016/j.jas.2017.04.009.
[37] R. Glaus, J. Koch, D. Günther, Portable laser ablation sampling device for elemental fingerprinting of objects outside the laboratory with laser ablation inductively coupled plasma mass spectrometry, Anal. Chem. 84 (12) (2012) 5358–5364, https://doi.org/10.1021/ac3008626.
[38] R. Glaus, L. Dorta, Z. Zhang, Q. Ma, H. Berke, D. Günther, Isotope ratio determination of objects in the field by portable laser ablation sampling and subsequent multicollector ICPMS, J. Anal. At. Spectrom. 28 (6) (2013) 801–809, https://doi.org/10.1039/c3ja30379a.