International experience and national contexts
Measuring attitudes towards the EU in cross-national research
M. Livia García Faroldi
M. Livia García Faroldi
International experience and national contexts
Measuring attitudes towards the EU in cross-national research
Arbeitspapiere – Working Papers Nr. 120, 2009
Mannheimer Zentrum für Europäische Sozialforschung
García Faroldi, M. Livia:
International experience and national contexts: measuring attitudes towards the EU in cross-national research / M. Livia García Faroldi. – Mannheim : 2009
(Arbeitspapiere - Mannheimer Zentrum für Europäische Sozialforschung ; 120) ISSN 1437-8574
Not available in book shops.
Token fee: € 3,00
Purchase: Mannheimer Zentrum für Europäische Sozialforschung (MZES), D – 68131 Mannheim WWW: http://www.mzes.uni-mannheim.de
Editorial Note:
M. Livia García Faroldi teaches at the University of Málaga, Spain. Her research interests are Euro- pean integration, European identity and social network analysis. Her Ph.D. project (2005) focused on the dissemination of positive attitudes towards the EU and European identity through personal net- works in Spain. She was Visiting Researcher at MZES from June to December 2008, invited by Prof.
van Deth. During her stay, she studied what factors influence attitudes towards the EU, paying special attention to national contexts as well as the international experience of individuals.
Abstract
Since the early nineties, public opinion on European topics has become increasingly important for the development of the integration process. This working paper focuses on two factors that influence atti- tudes towards the EU: international experience of individuals and national contexts. Although individu- als who have contacts with other European countries and citizens tend to be more supportive of the EU, their attitudes, opinions and images also develop through their national cultures, which frame their way of perceiving things. To confirm the influence of both variables, this paper proposes an instrument for measuring international experience and tests it using data from two Eurobarometer surveys, carried out in 1997 and 2001. Results confirm the importance of international experience, especially for people with a high level of such experience, although individual experience is shaped by national contexts.
Analyses show that national context is a key factor in understanding the support for or opposition to the integration process.
Contents
1. Introduction: how individual experience and national contexts shape attitudes towards the EU... 1
2. Objectives and hypotheses ... 2
3. Measuring attitudes towards the European Union and international experience... 6
3.1. Measuring attitudes towards the EU... 6
3.2. Measuring international experience... 11
4. Application of the instrument for measuring attitude towards the European Union and international experience... 13
4.1. Descriptive analysis: distribution of the EU meaning index, EU future support index and international experience in the EU members... 13
4.1.1. EU meaning index and EU future support index... 13
4.1.2. International experience ... 20
4.2. Controlling for alternative explanations... 22
5. Explaining attitudes towards the EU... 26
5.1. Explaining the EU meaning index and the EU future support index... 29
5.2. Instrumentalism and pragmatism... 33
5.3. The importance of national contexts for shaping attitudes towards the EU ... 36
6. Conclusions ... 38
References ... 42
1. Introduction: how individual experience and national contexts shape attitudes towards the EU
The European Union is a political construct like no other in the international system. How to describe this construct has been debated, but what is interesting for our purposes is that—after decades of perceiving the EU as a project driven by elites and during which citizens showed a “permissive con- sensus” (Lindberg and Scheingold, 1971)—the importance of EU citizens in understanding the ongo- ing integration process has increased in recent years, especially since the approval of the Treaty on European Union in the early nineties. The question then is what factors influence Europeans’ attitudes towards the EU. Many responses have been suggested. Sociologists and political scientists have studied how a certain type of attitude could affect support for international institutions. More concretely, the European Union has been the main focus of attention since Inglehart’s hypothesis (1970) that people with postmaterialist values and higher levels of cognitive mobilization have a more positive attitude towards the EU. Another example of this interest is empirical research on trust among EU citizens (Niedermayer, 1995, Scheuer, 1999, Scheuer and Schmitt, 2004). Trust is one of Deutch’s main concepts in defining “sense of community”. Deutch (1957) believes that this sense requires mu- tual trust, a “we-feeling” and a partial identification in terms of self-images and interests. These condi- tions apply to any type of community, including international ones. As Scheuer (1999:30) indicates,
“the notions of identification and we-feeling are compatible with modern theories of intergroup rela- tions. Their starting point is the distinction between ingroups and outgroups. (…)The evolution of a sense of community among EU citizens is the result of ingroup formation” (author’s italics).
The notions of “we-feeling” and “ingroup formation” are related to social psychology and have been used for analysing European identity and attitudes towards the EU, as we will see in next section. But before I focus on social identity theory, I would like to point out that one way of strengthening Euro- peans’ “we-feeling” is to reduce prejudices among them. This reduction could be achieved through personal contact with people from other European countries. One of the most obvious ways of in- creasing international contacts is travel. Mobility of EU citizens is now easier and more frequent be- cause the barriers have disappeared in the Common Market. European institutions are very conscious of this fact and state that this mobility “encourages the sharing of cultures and promotes the concept of European citizenship” 1. In fact, one of the research projects funded by the European Commission in the Fifth Framework Programme has as its main objective to study whether the intra-EU migrant has a stronger sense of “Europeanness” and develops bicultural identities. Scholars participating in this pro- ject link this type of identity to contacts from the host country (Recchi and Nebe, 2003). Nevertheless, individuals do not have experiences in a vacuum. They are part of social groups, and their values, norms and common understandings shape their lives and the meaning they attached to their experi- ences. Attitudes towards the EU are no exception: European citizens’ image of the EU is filtered by national or subnational cultures (Díez Medrano, 2003).
1 “Action Plan for Mobility” (2000), cited in Recchi and Nebe (2003).
Because both international experience and national contexts could shape attitudes towards the EU, the aim of this paper is to study this influence and the interaction of these factors. In order to perform the analysis, I develop an instrument for measuring international experience. I then apply this instrument to explain attitudes towards the EU, taking into account national contexts. For this purpose, I use two Eurobarometer surveys (EB) carried out in 1997 and 2001.
2. Objectives and hypotheses
We specify two main objectives of this research: (i) to test whether international experience is relevant in explaining attitudes towards the EU after controlling for several socio-demographic variables usually included in this type of analysis and that have shown their relevance in earlier research; and (ii) to study the interactions between international experience and national contexts. The second goal seeks to determine which of the two factors is more important for shaping attitudes towards the EU. For ex- ample, what would be the attitude of a person with high international experience who lives in a Euro- sceptical country? of the individual who has never been abroad but is a citizen of a Euroenthusiastic member? The aims mentioned above are connected to three hypotheses:
(i) international experience has a positive impact on attitudes towards the EU (and European identity, although this last variable is not studied here);
(ii) national contexts (macro-level) are more important than background variables (individual- level) that have traditionally been used to explain these attitudes;
(iii) national contexts are more important than international experience when the latter is low, but international experience is more important than national context when international experience is high.
These hypotheses are supported by two theoretical approaches: the social identity theory and the sociological tradition, which study how frames influence the individual’s perceptions, attitudes and opinions. Both require further discussion before I explain the construction of the dependent and inde- pendent variables.
One of the most important theories of intergroup relations, the social identity theory, was developed by Tajfel (1981). Social identity is conceived as the knowledge people have of belonging to certain social groups along with the emotional and evaluative significance that they themselves give to that belong- ing. Individuals seek to obtain a positive evaluation of themselves, and part of this positive self-identity is satisfied by belonging to social groups. Social identity can only be defined by means of the effects of the social classifications that segment the social environment of an individual in his or her own group and in other groups. In other words, the “positive aspects of social identity” and the reinterpretation of the attributes and commitment to social action only take on significance in relation to, or in comparison with, other groups.
The social identity theory can be applied to study EU citizens as a social group. For this social group to exist, their belonging to the EU must contribute to positive aspects of people’s social identity. If this is not the case, they will not feel that they are members of this group. The examples of Spain and the United Kingdom could throw light upon this requirement. For Spain, joining the ECC in 1986 meant overcoming a long period of political and economic isolation and becoming part of a group of Euro- pean democracies. Consequently, this membership implied strong rewards for Spaniards’ identity.
Because the EU is perceived as a prestigious social group, being member has a positive effect on the social identity of Spaniards. Conversely, British people have a strong sense of being different from Europe and fear losing their national identity and culture (Díez Medrano, 2003). This perception of threat to their national identity is characteristic of the British2, although other factors should be taken into account to explain Euroscepticism in this country. As Spiering observes (2004:146), this phe- nomenon is “a product of national practices which in themselves have little to do with either ‘Europe’ or the European Union: the rituals of an adversarial political system and the commercial needs of the written press”.
Recent research on attitudes to European integration has focused on the importance of the type of identification held by individuals. People who are afraid that European integration could mean the loss of their national identities (their culture, their language) develop negative attitudes towards the EU (McLaren, 2004). The way people think about their identities—that is, whether they feel exclusively national or maintain a dual identity with a European component—is a great predictor of Euroscepticism (Hooghe and Marks, 2004). For example, Carey (2002) found that the likelihood of supporting the EU is only 26.4 per cent when an individual feels very attached to the nation and not attached to Europe.
Conversely, those who maintain a dual identification and feel attached to both the nation and Europe have a 72.5 per cent probability of supporting the EU. Most findings on the interaction between these identities show that they are compatible, with the exception of Great Britain, as mentioned above. For example, Duchesne and Frognier (1995) find a polarisation between cosmopolitans and locals: the development of a European identity is related to the weakening of local attachments, not the weaken- ing of national identities. More recently, Citrin and Sides (2004) show that those (a minority) who iden- tify more with Europe than with their country, feel very attached to their countries and very proud of them. Scholars who have participated in the EURONAT project (Ruiz Jiménez et al, 2004) also con- clude that the emergence of European identities does not weaken national ones.
If European and national identities may be compatible, however, we can ask what mechanisms explain how a person identifies with the EU to a greater or lesser extent and develops relatively positive or negative attitudes toward it. One of the factors (mentioned above and to be explained in more detail later) is the individual’s national framework. This is not the only explanation, however. In this study, I argue that international experience could be also an important factor for explaining attitudes towards the EU and European identity (as well as attitudes towards other international institutions). Gaertner and his colleagues (1999) explain how this could happen: when individuals categorise people, includ- ing themselves, their levels of category inclusiveness may change. It is possible that intergroup bias
2 Cfr. European Commission report Perceptions de l’Union européenne, 2001, p. 44.
could decrease in either a recategorisation process, in which members of two different groups are induced to conceive of themselves as a single, more inclusive superordinate group rather than as two separate groups; or a decategorisation process, in which members are induced to conceive of them- selves and others as separate individuals or to have more personalised interaction. One example of the recategorisation process is the creation of European citizenship in the 1992 Treaty on European Union. This new social category facilitates citizens’ group feeling3, while the decategorisation process could occur when people must interact directly with members from different groups, contrasting their personal experiences with social stereotypes present in their own groups.
Nevertheless, contacts alone are not enough. Familiarity with individuals from other ethnic groups reduce prejudice if they are interpreted as pleasant, and the likelihood of this interpretation increases in cases of voluntary, personal, cooperative contact between persons of equal status (Boehnke et al, 2007). This is why student exchange programmes are considered to be one way of increasing the importance of the European identity and positive attitudes towards the EU. Among such programmes, the Erasmus program is the most important. Since the start of the programme in 1987, 1,500,000 stu- dents have benefited from an Erasmus fellowship. In its report Erasmus success stories. Europe cre- ates opportunities, the European Commission (2007:4) remarks: “Countless student reports tell of the impact ERASMUS has had on the personal lives and personal development of the participating stu- dents -and also how ERASMUS has enhanced their perception of being European citizens”. Applying the social network perspective, De Federico (2003) shows that a process of declassification and re- classification occurs among Erasmus students. They change their perception of the concept “for- eigner” when they refer to their friends of other nationalities. Even British students who live in another European country for one year and who have grown up in a very sceptical national context regarding European integration consider themselves Europeans to a greater extent than do their fellow nationals.
These students observe that living abroad increased their awareness of belonging to a “European cultural space” (King and Ruiz-Gelices, 2003).
The second theoretical background in this work is related to frame theory. The concept of “frame” was developed by Newcomb (1953), who pointed out that attitudinal objects are not perceived in a vacuum, but in a given context that is determined by previous experience. The frame of reference functions like a perceptual context that exerts a selective influence on the way of perceiving things. People who are members of the same group tend to acquire similar frames of reference, because it is particularly im- portant for the members of a group to be able to communicate with each other about issues of com- mon interest. Attitudes will be similar insofar as people perceive the issue in question as falling within the frame of reference of the same goal. Shared frames of reference are the social norms4. Díez
3 As De Federico (2007:686) argues: “The state and the institutions of order are the most important and powerful agents of identification and categorization, as they try to obtain, if not a monopoly, a majority control of not only legitimate physical violence, but also legitimate symbolic violence, which includes the power to name, identify, categorize and enunciate what is what and who is who”.
4 Newcomb indicates two reasons why members of a group might disagree: the first is that two members of the same group are also members of other groups whose attitudes towards the issue in question differ from those of the group to which both belong; the second is that people from the same group can perceive a common object in the same way except in so far as their own interests regarding this object are opposed. This last
Medrano (2003) is one of the authors who has used this tradition recently to study attitudes towards the EU in Great Britain, Germany and Spain. Frames not only have a national base but vary across sociodemographic and political groups. Nevertheless, we focus our attention on national frames: “be- cause national states remain a key socialisation agency and the bounded space within which individu- als spend most of their lives, worldviews and thus framing processes differ across nations. (…) Frames mediate the effect of micro and macro sociological factors on people’s attitudes toward Euro- pean integration” (Díez Medrano, 2003:6).
In recent years, scholars have been aware of the importance of taking national contexts into account in studying attitudes towards the EU and European identity. The different factors that they stress can be classified as economic and political. The first perspective has been called “sociotropic utilitarianism”.
Its general hypothesis is that aggregate levels of support for the EU in a country could be explained using macroeconomic indicators, such as GDP, unemployment, EU budget returns or intra-EU trade (Eichenberg and Dalton, 1993; Anderson and Reichert, 1996, McLaren, 2006). Yet other scholars argue that “we have rather little evidence that the EC or European unification are evaluated in primarily economic terms” (Bosch and Newton, 1995:101). Regarding political factors, Anderson (1997) pro- poses using domestic politics to explain EU support. His reasoning is that European citizens have a low degree of information about the European Union; that is, their knowledge is limited. The question is then how people can form opinions about the EU. Anderson argues that feelings about national government play a prominent role. Those who are not satisfied with their government or the way de- mocracy works in their own country tend to project this feeling onto the EU. The opposite occurs with people satisfied with their national political system. Anderson introduces the satisfaction with democ- racy as a robust measure for this “proxy” model, because in the European context this variable ex- presses the degree of satisfaction with the way democracy is working at the time of the survey. Other authors have shown the connection between the outcomes in Maastricht Treaty’s referenda and na- tional politics (Franklin, Van der Eijk and Marsh, 1995). Kritzinger (2003) analysed four countries and concluded that national evaluations influence attitudes towards the EU.
Some authors argue for different reasoning, while maintaining the stress on national political factors:
citizens who evaluate their national institutions negatively tend to evaluate European institutions in positive terms. Sánchez-Cuenca (2000:153) admits that “without controlling for supranational vari- ables, as Anderson does, domestic variables such as satisfaction with democracy have a positive impact on support. But (…) once supranational variables such as satisfaction with European institu- tions are controlled for, the sign of the domestic variables is inverted, so that a better opinion of the national government produces a decrease in support for integration”. He confirms his hypothesis with an analysis of the desired rhythm of integration in the EU-15, taking into account different national political factors as well as European ones.
reason supports the utilitarian approach to EU attitudes, as we will see below (cfr. Chapter 8, “The Formation of Group Norms”, pp. 221-255).
3. Measuring attitudes towards the European Union and international experience
This section explains the variables I have used as dependent and independent variables for testing the influence of international experience on attitudes towards the EU. First, I focus on the construction of two indexes of European attitudes: the EU meaning index and the EU future support index. Second, I use two questions to measure international experience: the number of countries the respondent has visited in the previous two years and whether he/she has contacts abroad.
3.1. Measuring attitudes towards the EU
The selection of the Eurobarometers in this study was determined by the fact that the research re- quires a survey that includes both European attitudes and international experience. This limitation meant choosing EB 47.2 and EB 55.1 (see Section 3.2. for more details). Unfortunately, these surveys did not include the most common items used by researchers for measuring attitudes towards the EU, such as whether the country has benefited from being member of the EU or if the membership is a good or bad thing. The EBs do include, however, two multiple response questions for measuring what the EU means for the respondent and what changes the EU will have brought in ten years. Both ques- tions are directly related to attitudes towards the EU and have been used as dependent variables in our work to construct two indexes. The exact formulations of these two questions are:
* Which of the following statements best describe(s) what the EU means to you personally?
a) A way to create a better future for young people (positive) b) A European government (instrumental.)
c) The ability to go wherever I want in Europe (instrumental) d) Guaranteed lasting peace in Europe (positive)
e) A means of improving the economic situation in Europe (instrumental) f) A way to create jobs (instrumental)
g) A way to protect the rights of citizens (positive)
h) A lot of bureaucracy, a waste of time and money (negative) i) Just a dream, a utopian idea (negative)
j) The risk of losing our cultural diversity (negative) k) Other (spontaneous)
l) DK
* Taking everything into consideration, what will the EU have brought in ten years time?
a) A better quality of life for most people (positive)
b) More opportunities for people like me to find work (positive) c) More equality between men and women (positive)
d) Less discrimination against foreigners and people from other cultures or ethnic groups (posi- tive)
e) More difficulty in making decisions because more countries will have joined (negative) f) A higher level of unemployment (negative)
g) The use of the Euro as the single currency in Europe (pragmatic)
h) It will be easier to travel, study, work and live anywhere in Europe (pragmatic) i) More social problems (redundancies, strikes, disputes) (negative)
j) There won’t be a EU anymore (spontaneous)(negative) k) Other (spontaneous)
l) Other m) DK
From the first multiple response question, I developed the so-called “EU meaning index”. After elimi- nating the categories “other” and DK, I divided the responses into three groups, which are mentioned in brackets: positive meanings (options a, d, and g), negative meanings (h, I, and j) and instrumental meanings (b, c, e, and f). Although instrumental meanings could be considered, at least in part, as related to a positive attitude (this is, in fact, the rational actor hypothesis for explaining support to the EU), I prefer to separate them for two reasons. First, they could be considered more “rational”, less
“affective” than the rest of positive responses. Although the response “European government” has a clear political content that is absent from the other items, it has been included here because its am- biguous formulation does not permit us to assess whether respondents are thinking of a European government as something positive, negative or neutral, or simply as an actual fact. Second, if I include them as positive meanings, the index (result of subtracting negative responses from positive ones) will always be positive, as there will be 7 positive answers and 3 negative ones. This grouping will always produce three positive and three negative items.5 I excluded instrumental responses from the index (as well as people who did not select any of the possible answers) and analysed these respondents separately. Of course, a respondent (with either a positive or negative value in the index) could also select instrumental responses. In fact, in EB 47.2, 22.5 per cent of the people who have other responses also mentioned a European government (27.7 per cent in EB 55.1), 37 per cent free mobility (41.3 in 2001), 32.9 per cent improving economic situation (31.8 in EB 55.1) and 31.5 per cent a way to create jobs (27.8 per cent four years later). The index runs from -3 to +3. Nevertheless, the causal analyses use a simplified version, with 5 values (very negative for -3 and -2/ fairly negative for - 1/ neutral for 0/ fairly positive for +1 and +2/ very positive for +3).6
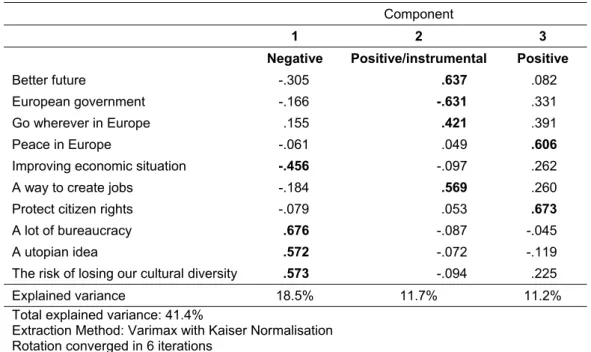
Table 3.1.1. Dimensions of EU meaning index, 1997 (principal component analysis)
Component 1 2 3
Negative Positive/instrumental Positive Better future -.305 .637 .082 European government -.166 -.631 .331 Go wherever in Europe .155 .421 .391 Peace in Europe -.061 .049 .606
Improving economic situation -.456 -.097 .262 A way to create jobs -.184 .569 .260
Protect citizen rights -.079 .053 .673
A lot of bureaucracy .676 -.087 -.045 A utopian idea .572 -.072 -.119 The risk of losing our cultural diversity .573 -.094 .225 Explained variance 18.5% 11.7% 11.2%
Total explained variance: 41.4%
Extraction Method: Varimax with Kaiser Normalisation Rotation converged in 6 iterations
N= 8,882
5 Another possibility for balancing the two types of responses is to weight them, giving lower weight to positive than to negative ones. For my purposes, however, it is better to distinguish positive from instrumental options.
6 The correlation between the seven-item index and the five-item index is above 0.98 (p< 0.01) for both years.
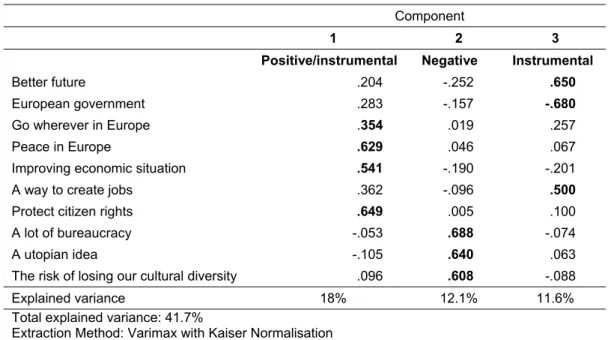
Table 3.1.2. Dimensions of EU meaning index, 2001 (principal component analysis)
Component
1 2 3
Positive/instrumental Negative Instrumental Better future .204 -.252 .650 European government .283 -.157 -.680
Go wherever in Europe .354 .019 .257 Peace in Europe .629 .046 .067 Improving economic situation .541 -.190 -.201 A way to create jobs .362 -.096 .500
Protect citizen rights .649 .005 .100 A lot of bureaucracy -.053 .688 -.074
A utopian idea -.105 .640 .063 The risk of losing our cultural diversity .096 .608 -.088 Explained variance 18% 12.1% 11.6%
Total explained variance: 41.7%
Extraction Method: Varimax with Kaiser Normalisation Rotation converged in 5 iterations
N= 8,913
I expect that negative responses load on the same factor and instrumental ones are grouped together, but not necessarily alone because they could share a factor with some positive responses. To check the three categories I have created, I made a principal component analysis for each year (Tables 3.1.1 and 3.1.2). In both EBs, three dimensions emerged that were composed of quite similar items, al- though their order differs for the two years. The total amount of variance explained is around 41.5 per cent in both years. In 1997, the dimension that explains a higher amount of variance is composed of negative meanings of the EU, while in 2001 positive and instrumental items compose the first loading factor. In both years, instrumental meanings are grouped with positive ones (the only case in which an instrumental response loads with critical meanings of the EU has a negative value relative to them).
However, these four items are not all located together in the same dimension. It is quite surprising that two responses that correlated strongly a priori (improving economic situation and a way to create jobs) belong to different factors. The explanation for this phenomenon may be that respondents selected only one of the responses precisely because they are perceived to be very similar. One can conclude that the most robust (stable) factor is the one with negative statements. It is worth paying attention to the peculiar behaviour of the item most closely related to politics, that is, the European government, which shows a negative value when compared to “better future” and “a way to create jobs” in both years. The latter have positive values and share the factor with it. It is difficult to interpret this result without further research, but it seems that people who tend to mention the political aspect of the EU (the government) do not select the economic aspect (jobs) or the positive one (better future) as other meanings.
With the second question, I construct the “EU future support index”. I decided to use this name be- cause the responses chosen allow me to deduce whether attitudes towards the EU are positive or
negative regarding the future. I proceeded in a similar way, deleting the “other responses” and DK and dividing the remaining responses into positive (a, b, c, and d), negative (e, f, I, and j) and what I would like to call “pragmatic” answers, that is, the two responses concerning the use of the Euro and free mobility (options g and h). I call them “pragmatic” because in 1997 (EB 47.2) a majority of countries were involved in an effort to adjust their economies to the “Maastricht criteria” in order to join the single market with a single currency few years later. At the moment of the EB 55.1 field (2001), this was a reality. Thus, although these pragmatic responses may also be related to positive attitudes towards the EU, it did not seem very “enthusiastic” to select only these categories. In addition, freedom of mobility was already a reality in both moments of the surveys. Thus, selecting the Euro and free mobility like that which the EU will bring about in ten years represents a pragmatic approach to the future, although it could be related to positive attitudes towards the EU. As in the previous case, people who selected only pragmatic responses were not included in the index (nor were people who did not select any of the possible answers) and were analysed separately. In EB 47.2, people who selected other re- sponses mentioned the Euro in 41.4% of the cases and free movement in 47.2%. IN EB 55.1, the re- sult was 49.7% and 47.0%, respectively. The index runs from -4 to +4. Nevertheless, for crosstabs for the causal analyses, I used a simplified version, with 5 values (very negative for -4 and -3/ fairly nega- tive for -2 and -1/ neutral for 0/ fairly positive for +1 and +2/ very positive for +3 and +4) 7.
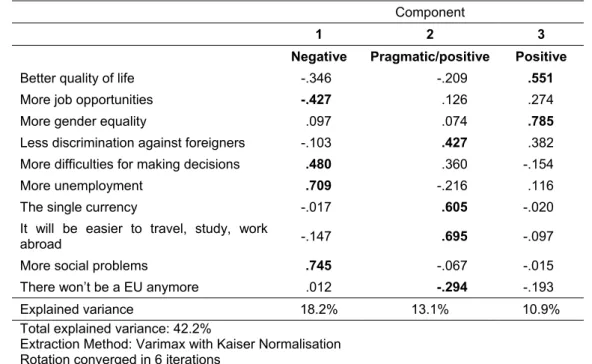
Table 3.1.3. Dimensions of EU future support index, 1997 (principal component analysis)
Component 1 2 3
Negative Pragmatic/positive Positive Better quality of life -.346 -.209 .551
More job opportunities -.427 .126 .274 More gender equality .097 .074 .785
Less discrimination against foreigners -.103 .427 .382
More difficulties for making decisions .480 .360 -.154 More unemployment .709 -.216 .116 The single currency -.017 .605 -.020
It will be easier to travel, study, work
abroad -.147 .695 -.097
More social problems .745 -.067 -.015 There won’t be a EU anymore .012 -.294 -.193
Explained variance 18.2% 13.1% 10.9%
Total explained variance: 42.2%
Extraction Method: Varimax with Kaiser Normalisation Rotation converged in 6 iterations
N= 8,864
7 The correlation between the nine-item index and the five-item index is above 0.95 (p< 0.01) for both years.
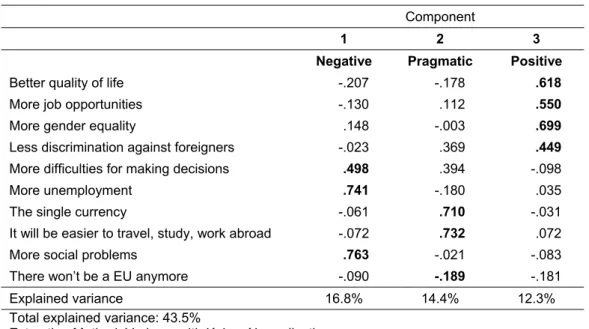
Table 3.1.4. Dimensions of EU future support index, 2001 (principal component analysis)
Component 1 2 3
Negative Pragmatic Positive Better quality of life -.207 -.178 .618 More job opportunities -.130 .112 .550 More gender equality .148 -.003 .699 Less discrimination against foreigners -.023 .369 .449
More difficulties for making decisions .498 .394 -.098 More unemployment .741 -.180 .035 The single currency -.061 .710 -.031
It will be easier to travel, study, work abroad -.072 .732 .072
More social problems .763 -.021 -.083 There won’t be a EU anymore -.090 -.189 -.181
Explained variance 16.8% 14.4% 12.3%
Total explained variance: 43.5%
Extraction Method: Varimax with Kaiser Normalisation Rotation converged in 5 iterations
N= 8,810
To check the three categories created, I performed a principal component factor analysis. The results are shown in Tables 3.1.3. and 3.1.4. I expected that negative responses would be grouped in one factor and pragmatists would correlate positively among them. As with the other positive responses, although to a lesser extent than in the previous principal component analysis, three dimensions were found in both EBs. The total explained variance is slightly greater in 2001. For both years, it is higher for this question than for the question on EU meaning. In both analyses, the first dimension (which explains a higher amount of variance) is composed of negative responses to what the EU will bring in the future. As “there won’t be EU” (that is, a spontaneous option mentioned by less than 2% of the respondents, see Table 4.1.1.3), the highest value is negative and is located in the second dimension, with pragmatic responses. This means that people who tend to be pragmatic do not believe that the EU will disappear in the near future. In conclusion, the principal component analysis shows even more robust results for this question than for the previous one, results perfectly adapted to my classification.
The two indexes have a correlation of 0.532 (p< 0.01) for both years. This correlation implies that both indexes measure different but connected phenomena. This result could be due, in part, to the design of the questions, because items are not equivalent in them. It could also be related, however, to the fact that one question asks about the EU’s present and the other about its future. When surveys in- clude an evaluation of the present and future economic situations, correlations are high but not perfect.
For example, in EB 68 (2007) 58 per cent of citizens claim to be satisfied with the situation of the European economy, but only 45 per cent consider that this situation will be the same over the next twelve months.
3.2. Measuring international experience
Some scholars have studied the impact of international experience on attitudes towards the EU, but they have not included an item for measuring the number of international contacts, whether friends or kinship relationships (Green, 1999). Scholars who have taken this aspect into account perform qualita- tive research without a representative sample (Boehnke et al, 2007). Other empirical research has focused on specific groups, such as international students (King and Ruiz-Gelices, 2003, De Federico, 2003), intra-EU migrants (PIONEUR project), people living on EU borders (Boehnke et al, 2007, Schmidberger, 1998) or high-skilled migrants who frequently use Eurostar trains (Favell, 2008). My research focuses on young people age 15 to 24 years in the EU-15. It was my intention to study the whole population, but I was limited by the type of question relevant to testing my hypothesis. Only two Eurobarometers (EBs) included items that could be used as a “proxy” for international contacts while at the same time asking questions directly related to attitudes towards the EU. Both surveys involved a special youth sample. These items are exactly the same in both surveys (EB 47.2 and EB 55.1). Using them (9,818 and 9,731 respondents, respectively) enables me to compare responses of young people in two moments in time, 1997 and 2001.8 Indeed, these two years have special significance for EU integration. In 1997, the Amsterdam Treaty was signed, revising the Maastricht Treaty. 2001 is the last year national currencies circulated in the 12 member countries of the Euro-zone, since the Euro be- came the only currency among these countries on January 1, 2002. In other EBs with a representative sample from the entire population, one of these two elements (international contacts or attitudes to- wards the EU) was not present, so it was impossible to use them together.
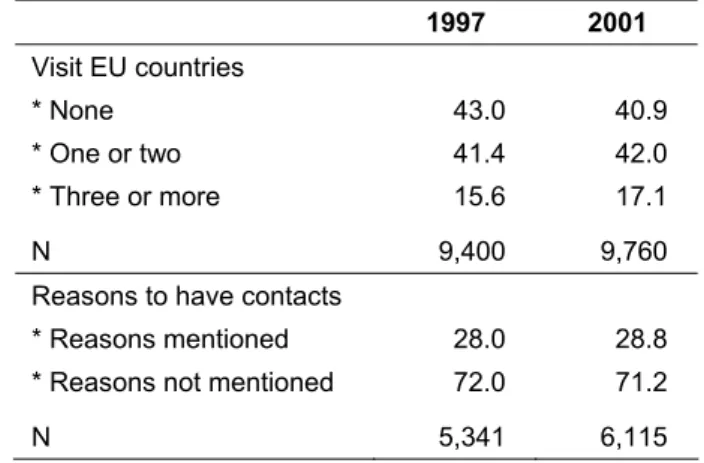
Both EBs were dedicated to the use of foreign languages and include two questions that could be used as “proxies” for international experience. The first question asked “which of the 15 EU countries have you visited in last two years”. I created a variable with 3 categories: no visiting of EU countries, visiting 1 or 2 countries, visiting 3 or more countries. For the purposes of the research, it would be better to have a measure of all the countries that the respondent has ever visited, because a timespan of the last two years lacks precision as indicator of international experience, especially in the case of older respondents. On the one hand, a young person might have travelled abroad for the first time in last two years, such that the measure overestimates her experience; on the other, a person who has not travelled in last two years for personal reasons but has been abroad many times before would not be seen as having international experience. Unfortunately, information on the entire life of the respon- dent is not available in the EB selected. I therefore used trips in last two years as a “proxy” for coun- tries that someone has ever visited.
8 The questions which adjust better to my hypothesis are only present in one Eurobarometer (EB 28.1, 1987) There are two questions related to international experience that could be used as independent variables. The first asks what number of EC countries “have you already visited, for any reason at all”. The second question states: “Have you ever been abroad? If yes, taking together all the times that you have been abroad, including holidays as well as other trips, how much time altogether spent abroad?” As dependent variables, the EB includes questions such as the benefit of the membership for the country. I have not used this Eurobarometer for 3 reasons: first, I cannot compare the results with later years because in EB 47.2 and EB 55.1, other questions have been included; second, this EB was carried out in 1987 a time at which the international European context was very different from than in 1997 and 2001, and mobility to other countries was more restricted; third, in 1987 two countries (Spain and Portugal) had just joined the ECC and three more were not yet members (Austria, Finland and Sweden).
The second question was multiple response and asked the reason for going to the countries visited (and was thus filtered by the first question). The possible answers were:
a) To visit the country, spend my holiday b) In a youth exchange programme c) To learn or to improve the language d) To study
e) To work, on business f) For medical reasons
g) To meet my girlfriend/boyfriend h) To live there with my family i) Others (spontaneous)
This question is used as a “proxy” for determining the person’s international contacts. It has been as- sumed that all options except spending holidays, medical reasons and others (“other” being ambigu- ous because it does not include the exact reason given by respondents), probably imply contact with other Europeans (from the host country or from others), so I created a dichotomous variable to differ- entiate among those respondents who mentioned some reason that could imply personal interaction with others Europeans and people who did not mention those reasons. This is a conservative measure in two ways. First, a person could have contacts with people from other countries without travelling—
for example when the foreigner lives in the respondent’s country—and this relation affects attitudes.
Second, although it is probable that you make friends when you spend your holidays in another coun- try (even if this is a short period or a weak relation), people who answer that they travelled for their holidays have been considered as not having contacts. Indeed, if we take into account that the measure refers only to the two years prior to the interview, we can be sure that we are not overesti- mating the number of international contacts young people have abroad.9
Other scholars (Green, 1999) have used language skills as a measure of international experience.
Both EBs ask, “apart from your mother tongue, which of these languages can you speak well enough to take part in a conversation?” I could have included this question as a third measure of international experience. There is no doubt that speaking other European languages fluently could increase the opportunities of meeting people from other countries, but it is not absolutely necessary. People can travel to other countries although they do not speak the host language and these trips could influence their perceptions and attitudes towards the EU in any case. People can also meet foreigners who speak their mother tongue, so it is not compulsory for them to speak another language. Indeed, people whose languages share a common origin (such as Italian and Spanish, for example) do not need to speak the foreign language to understand and be understood. One could also question the appropri- ateness of the question, because its formulation is subjective: how much is “well enough”? Lastly, differences in language skills are great among EU countries, and these differences depend on multiple factors (geographical situation, one or more official languages in the country, educational systems…) that are difficult to control in this research. Nevertheless, I repeated all of the analyses in Section 5 using the EU meaning index and EU future support index as dependent variables and including the
number of foreign languages respondents speak as the independent variable (results not shown here).
In 1997, this variable is significant on only two occasions. In 2001, however, the relevance of lan- guages is higher. In short, this variable replaces the number of trips as a significant variable when the EU future support index is considered, while travelling to other countries retains its significance when the EU meaning index is studied. In any case, since the explained variance of the models that include the language variable is quite similar to that of models without it, I have not used it in the following analyses.
4. Application of the instrument for measuring attitude towards the European Union and international experience
After explaining the construction of the two dependent variables (EU meaning index and EU future support index) and the selection of the two variables for measuring international experience, the first part of this section shows how these variables are distributed among the EU member states. The second part focuses on socio-demographic variables that could influence attitudes towards the EU (sex, age, education and occupational status) according to different theoretical approaches that will be explained and on how these variables are distributed among the countries.
4.1. Descriptive analysis: distribution of the EU meaning index, EU future support index and international experience in the EU members
4.1.1. EU meaning index and EU future support index
As we can see in Table 4.1.1.1, the most common answer to what the EU means for young people is the same in both years: free mobility (an item whose relevance increased over 4 percentage points, from 34.8 to 39.1). The second and third responses are different in both years: in 1997, a better future is very close to the mobility item. A bit farther away, we find the creation of jobs, selected by almost 30% of young people. Four years later, a European government and improving the economic situation are the answers most frequently mentioned. We can see, then, that a more affective meaning was present in 1997 and a more political one in 2001 (at a time of great debate on EU enlargement, the necessity of a Constitution and the reinforcement of political institutions, and a time when the Euro- pean Central Bank had already been created and had made decisions on economic issues, etc.). The third answer is economic. Although it is not the same in 1997 and 2001, both items are “instrumental”.
Factor analysis shows that they are related to positive responses. The less frequently selected items are negative, such as those that see the EU as an unrealistic utopia or as a threat to cultural diversity.
9 It is clear that direct contact is not the only type of contact two people could have, given the different modes of communication through Internet currently available.
Table 4.1.1.1. Frequencies of the responses to EU meaning (multiple response question) 1997 2001
Better future 34.2 28.1 European government 26.2 31.2 Free movement 34.8 39.1
Peace 24.1 22.7
Improving economic sit. 34.0 31.1 Creation of jobs 29.4 24.4 Protect rights of citizens 13.1 15.9
Bureaucracy 14.4 11.9 Utopian idea 7.6 5.1
Losing cultural diversity 12.0 11.0
Other 1.1 1.5
DK 5.0 7.9
N 8,882 8,913
Source: EB 47.2 and 55.1. Weighted sample.
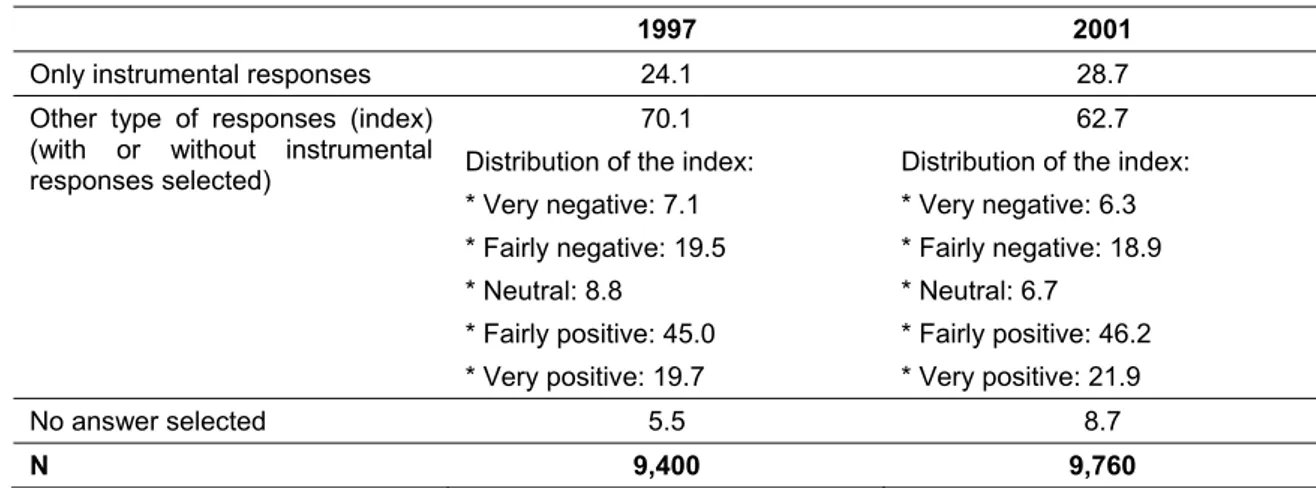
Table 4.1.1.2 shows how many people could be considered “instrumental”. This category was created as a result of a principal component analysis (see Section 3.1.) and refers to people who only mention as significant the EU items related to economic issues or European government. The table also in- cludes the percentage of respondents who scored in the EU meaning index and/or those who did not answer the question. The importance of instrumental people has increased over time (almost 5 per- centage points), as does the proportion of people who do not answer the question (3 points). Obvi- ously, this means that the proportion of respondents included in the index is lower in 2001. If we look to the distribution of the index, a majority of the respondents attribute a fairly positive meaning to the EU, very negative responses have decreased slightly and very positive ones have increased. We can conclude that, among people who do not only see the EU from an economic point of view and who have an opinion about it, its meaning is more positive in 2001 than in 1997.
Table 4.1.1.2. Frequency of instrumental responses, EU meaning index and no answers (percentage)
1997 2001 Only instrumental responses 24.1 28.7
Other type of responses (index) (with or without instrumental responses selected)
70.1 Distribution of the index:
* Very negative: 7.1
* Fairly negative: 19.5
* Neutral: 8.8
* Fairly positive: 45.0
* Very positive: 19.7
62.7 Distribution of the index:
* Very negative: 6.3
* Fairly negative: 18.9
* Neutral: 6.7
* Fairly positive: 46.2
* Very positive: 21.9 No answer selected 5.5 8.7
N 9,400 9,760
Source: EB 47.2 and 55.1. Weighted sample.
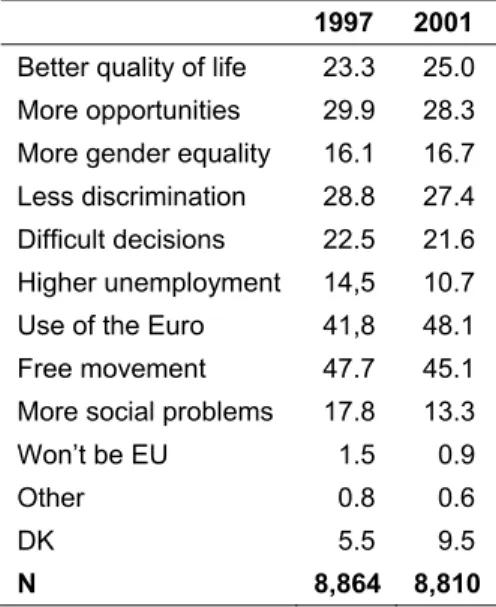
The frequency of response to the second index (Table 4.1.1.3) shows that the future for young people is related to the Euro and free mobility (the two pragmatic responses), although in 1997 currency takes second place and in 2001 (a few months before the Euro actually became the currency of 12 member states) has greater presence in the minds of young people. Free mobility has quite a similar percent- age in both years. The third response is more opportunities, although it is followed closely by less dis- crimination against foreigners. Both aspects are positive, although the first has an economic perspec- tive, while the second is more related to politics and society. Lastly, negative responses constitute the lowest responses, although their percentage is higher than in the case of the EU meaning index. The least mentioned item is the one stating that the EU will not exist in ten years, an answer that has de- creased, perhaps because the creation of the Euro and a really unified market has been seen as the proof of the stability of the EU.
Table 4.1.1.3. Frequency of responses to what the EU will bring in 10 years (multiple response question)
1997 2001 Better quality of life 23.3 25.0 More opportunities 29.9 28.3 More gender equality 16.1 16.7 Less discrimination 28.8 27.4 Difficult decisions 22.5 21.6 Higher unemployment 14,5 10.7 Use of the Euro 41,8 48.1 Free movement 47.7 45.1 More social problems 17.8 13.3 Won’t be EU 1.5 0.9
Other 0.8 0.6
DK 5.5 9.5
N 8,864 8,810
Source: EB 47.2 and 55.1. Weighted sample.
Table 4.1.1.4 shows the number of pragmatists, the distribution of the EU future support index and the percentage of nonresponses. Both the index and pragmatism are the result of the principal component analysis discussed in Section 3.1: pragmatists are defined as respondents who have only selected the Euro and/or freedom of movement as what the EU will bring in the future), while people who select other types of responses have a score in the index. We can see that the number of pragmatists is less than a half of that of instrumentalists and has increased less than the former. Of course, it could be that the development of the two constructs (the first with two items and the second with four) has influ- enced this result. However, it could also be argued that, when young people think about the EU in the future, they project additional ideas not related to economic issues. Interestingly, the number of nonrespondents in 2001 is almost double than in 1997. Very negative responses have decreased and very positive ones increased, although both are less frequent than in the EU meaning index.
Table 4.1.1.4. Frequency of pragmatic responses, EU future support index and no answers (percentage)
1997 2001 Only pragmatic responses 11.1 13.5
Other type of responses (index) (with or without pragmatic re- sponses selected)
83,2 Distribution of the index:
* Very negative: 3.3
* Fairly negative: 25.3
* Neutral: 11.7
* Fairly positive: 52.9
* Very positive: 6.9
76.7 Distribution of the index:
* Very negative: 2.1
* Fairly negative: 23.6
* Neutral: 10.4
* Fairly positive: 55.6
* Very positive: 8.4 No answer selected 5.7 9.7
N 9,400 9,760
Source: EB 47.2 and 55.1. Weighted sample.
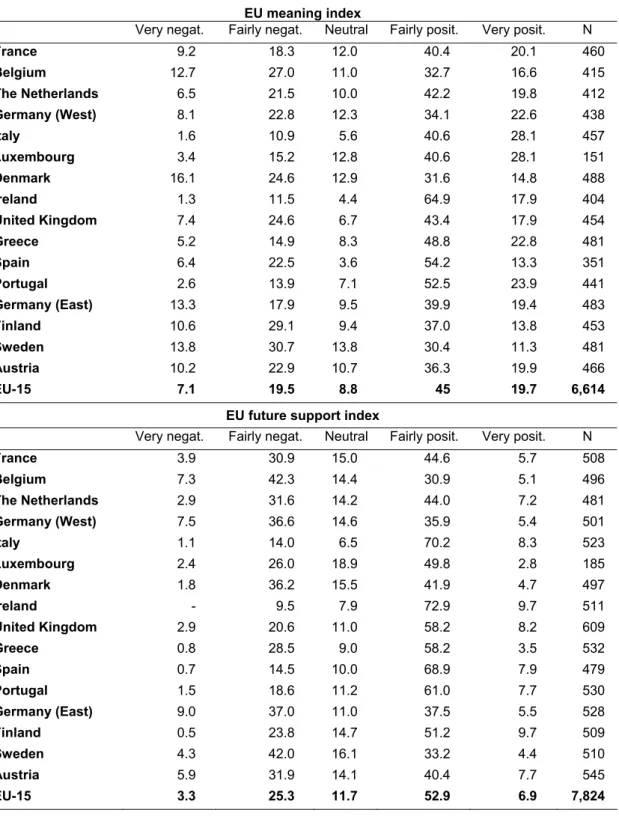
Table 4.1.1.5 shows the distribution of the responses to the two indexes in EB 47.2. Regarding the EU meaning index, we first observe that the difference between the countries with the most and least fre- quent negative responses is very high: 13.3 per cent for East Germany and 1.3 per cent for Ireland (Italy is very close, with 1.6 per cent). Second, the percentage of very positive responses is almost three times that of negative ones, and the differences in relative terms among countries are lower: Italy and Luxembourg have the highest percentages (28.1 per cent) and Sweden the lowest (11.3 per cent).
The EU support index offers an outlook with some differences: no Irish respondent expresses a very negative view of the future, but Greece and Spain replace Italy as the countries with the lowest per- centage (although Italy is below the EU-mean). The countries with the most positive responses are Ireland and Finland (9.7 per cent), a striking result in the second case since Finns also gave fewer negative responses than the mean, a trend that does not fit with the traditional sceptical position of this country towards integration (see, for example, McLaren, 2007 and Sánchez-Cuenca, 2000). Ireland and Finland are followed by Italy and the UK, also an unexpected result. We will return to these results in Table 4.1.1.7.
Table 4.1.1.5. EU meaning index and EU future support index (1997) EU meaning index
Very negat. Fairly negat. Neutral Fairly posit. Very posit. N
France 9.2 18.3 12.0 40.4 20.1 460
Belgium 12.7 27.0 11.0 32.7 16.6 415
The Netherlands 6.5 21.5 10.0 42.2 19.8 412 Germany (West) 8.1 22.8 12.3 34.1 22.6 438
Italy 1.6 10.9 5.6 40.6 28.1 457
Luxembourg 3.4 15.2 12.8 40.6 28.1 151
Denmark 16.1 24.6 12.9 31.6 14.8 488
Ireland 1.3 11.5 4.4 64.9 17.9 404
United Kingdom 7.4 24.6 6.7 43.4 17.9 454
Greece 5.2 14.9 8.3 48.8 22.8 481
Spain 6.4 22.5 3.6 54.2 13.3 351
Portugal 2.6 13.9 7.1 52.5 23.9 441
Germany (East) 13.3 17.9 9.5 39.9 19.4 483
Finland 10.6 29.1 9.4 37.0 13.8 453
Sweden 13.8 30.7 13.8 30.4 11.3 481
Austria 10.2 22.9 10.7 36.3 19.9 466
EU-15 7.1 19.5 8.8 45 19.7 6,614
EU future support index
Very negat. Fairly negat. Neutral Fairly posit. Very posit. N
France 3.9 30.9 15.0 44.6 5.7 508
Belgium 7.3 42.3 14.4 30.9 5.1 496
The Netherlands 2.9 31.6 14.2 44.0 7.2 481 Germany (West) 7.5 36.6 14.6 35.9 5.4 501
Italy 1.1 14.0 6.5 70.2 8.3 523
Luxembourg 2.4 26.0 18.9 49.8 2.8 185
Denmark 1.8 36.2 15.5 41.9 4.7 497
Ireland - 9.5 7.9 72.9 9.7 511
United Kingdom 2.9 20.6 11.0 58.2 8.2 609
Greece 0.8 28.5 9.0 58.2 3.5 532
Spain 0.7 14.5 10.0 68.9 7.9 479
Portugal 1.5 18.6 11.2 61.0 7.7 530
Germany (East) 9.0 37.0 11.0 37.5 5.5 528
Finland 0.5 23.8 14.7 51.2 9.7 509
Sweden 4.3 42.0 16.1 33.2 4.4 510
Austria 5.9 31.9 14.1 40.4 7.7 545
EU-15 3.3 25.3 11.7 52.9 6.9 7,824
Source: EB 47.2. Weighted sample by country and for EU-15
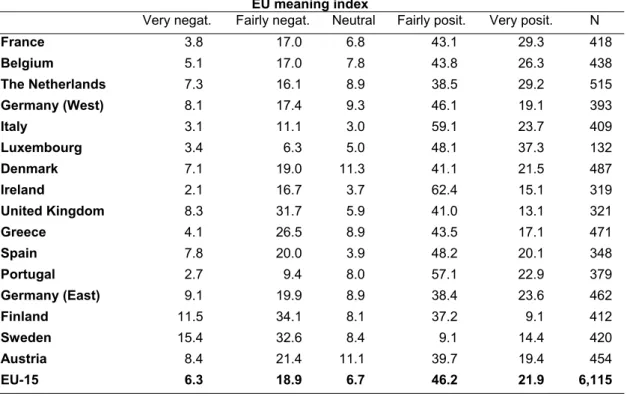
Table 4.1.1.6. shows the same indexes for the year 2001. Ireland maintains first position with the low- est percentage of negative responses to EU meaning, although the percentage has increased. Swe- den is the most negative country. The most positive responses come from Luxembourg, followed by France and the Netherlands. Regarding future support, Ireland and Italy have the lowest percentages of very negative values of the index, followed by Spain and Portugal, these two countries also provided
the highest percentages of very positive answers. As Finland now has a more negative position, it is possible that the result shown earlier was determined by contextual factors, such as having joined the EU only two years before the EB was performed.
Table 4.1.1.6. EU meaning index and EU future support index (2001) EU meaning index
Very negat. Fairly negat. Neutral Fairly posit. Very posit. N
France 3.8 17.0 6.8 43.1 29.3 418
Belgium 5.1 17.0 7.8 43.8 26.3 438
The Netherlands 7.3 16.1 8.9 38.5 29.2 515 Germany (West) 8.1 17.4 9.3 46.1 19.1 393
Italy 3.1 11.1 3.0 59.1 23.7 409
Luxembourg 3.4 6.3 5.0 48.1 37.3 132
Denmark 7.1 19.0 11.3 41.1 21.5 487
Ireland 2.1 16.7 3.7 62.4 15.1 319
United Kingdom 8.3 31.7 5.9 41.0 13.1 321
Greece 4.1 26.5 8.9 43.5 17.1 471
Spain 7.8 20.0 3.9 48.2 20.1 348
Portugal 2.7 9.4 8.0 57.1 22.9 379
Germany (East) 9.1 19.9 8.9 38.4 23.6 462
Finland 11.5 34.1 8.1 37.2 9.1 412
Sweden 15.4 32.6 8.4 9.1 14.4 420
Austria 8.4 21.4 11.1 39.7 19.4 454
EU-15 6.3 18.9 6.7 46.2 21.9 6,115
EU future support index
Very negat. Fairly negat. Neutral Fairly posit. Very posit. N
France 0.8 24.5 12.8 53.4 8.5 499
Belgium 2.2 30.5 12.9 47.3 7.1 512
The Netherlands 0.7 30.8 12.8 48.1 7.6 575 Germany (West) 4.8 31.0 13.0 45.5 5.6 464
Italy 0.4 13.9 8.3 69.6 7.7 462
Luxembourg 1.6 18.8 13.3 54.5 11.8 165
Denmark 1.0 25.3 13.6 54.0 6.0 487
Ireland 0.4 10.0 7.9 71.1 10.6 442
United Kingdom 2.6 23.3 6.7 58.9 8.5 497
Greece 1.1 25.4 8.3 52.6 12.6 533
Spain 0.8 18.4 6.2 61.6 13.1 466
Portugal 0.9 12.0 8.8 71.6 6.8 491
Germany (East) 6.8 33.2 13.0 39.1 7.9 537
Finland 1.2 22.9 14.4 56.8 4.8 473
Sweden 3.6 36.3 14.2 40.5 5.3 501
Austria 3.7 25.6 15.2 46.9 8.5 532
EU-15 2.1 23.6 10.4 55.6 8.4 7,490
Source: EB 55.1. Weighted sample by country and for EU-15