Research Collection
Report
Analysis of knowledge and technology transfer in Switzerland – the perspective of the enterprises
Study elaborated as part of the report «Research and Innovation in Switzerland 2020» Part C, Study 4
Author(s):
Beck, Mathias; Hulfeld, Florian; Spescha, Andrin; Wörter, Martin Publication Date:
2020-12
Permanent Link:
https://doi.org/10.3929/ethz-b-000458050
Rights / License:
In Copyright - Non-Commercial Use Permitted
This page was generated automatically upon download from the ETH Zurich Research Collection. For more information please consult the Terms of use.
ETH Library
KOF Studies, No. 160, December 2020
Analysis of knowledge and technology transfer in Switzerland – the perspective of the enterprises
Study elaborated as part of the report «Research and Innovation in Switzerland 2020» Part C, Study 4
Mathias Beck, Florian Hulfeld, Andrin Spescha und Martin Wörter
Editor
KOF Swiss Economic Institute, ETH Zurich
© 2020 KOF Swiss Economic Institute, ETH Zurich DOI: 10.3929/ethz-b-000458050
Authors Mathias Beck Florian Hulfeld Andrin Spescha Martin Wörter
Imprint
ETH Zurich
KOF Swiss Economic Institute LEE G 116
Leonhardstrasse 21
8092 Zurich, Switzerland
Phone +41 44 632 42 39
Fax +41 44 632 12 18
www.kof.ethz.ch
kof@kof.ethz.ch
Contents
List of Illustrations ... i
List of Graphs ... i
List of Tables ... iii
1 Introduction ... 1
2 Conceptual framework ... 4
2.1 Literature and analytical framework model ... 4
2.2 Structure of the analysis ... 7
3 Data and methods ... 8
4 Analysis ... 10
4.1 Indicators of KTT ... 10
4.1.1 Incidence ... 10
4.1.2 Forms ... 15
4.1.3 Partners ... 39
4.1.4 Mediators ... 49
4.2 Drivers of KTT ... 57
4.2.1 Motives ... 57
4.2.2 Enterprise Characteristics ... 74
4.3 Outcomes of KTT ... 76
4.3.1 Enterprise Indicators ... 76
4.3.2 Performance: Analytical (econometric) Results ... 80
4.3.3 Innovation strategy, KTT, and firm performance ... 89
4.4 Policy Implications ... 92
4.4.1 Perceived Obstacles ... 92
4.4.2 Impediments: Enterprise characteristics and technological activities ... 128
4.4.3 Role of intermediaries for KTT ... 131
5 Conclusion ... 133
Bibliography ... 134
Appendix ... 138
Part I: Methodological tables ... 138
Part II: Descriptive tables ... 141
Incidence... 141
Forms ... 143
Partners ... 145
Mediators ... 147
Motives ... 149
Results ... 151
Impediments ... 152
Part III: Econometric tables ... 156
Determinants of propensity to KTT ... 156
Determinants of perceived impediments to KTT ... 157
Abbreviations ... 159
i
List of Illustrations
Illustration 1 ………. 5
List of Graphs Graph 1.1 ……… 10
Graph 1.2 ……… 12
Graph 1.3 ……… 13
Graph 2.1 ……… 15
Graph 2.2 ……… 16
Graph 2.3 ……… 18
Graph 2.1.1 ……… 19
Graph 2.1.2 ……… 20
Graph 2.1.3 ……… 21
Graph 2.2.1 ……… 23
Graph 2.2.2 ……… 24
Graph 2.2.3 ……… 25
Graph 2.3.1 ……… 27
Graph 2.3.2 ……… 28
Graph 2.3.3 ……… 29
Graph 2.4.1 ……… 31
Graph 2.4.2 ……… 32
Graph 2.4.3 ……… 33
Graph 2.5.1 ……… 35
Graph 2.5.2 ……… 36
Graph 2.5.3 ……… 38
Graph 3.1.1 ……… 40
Graph 3.1.2 ……… 42
Graph 3.1.3 ……… 43
Graph 3.2.1 ……… 45
Graph 3.2.2 ……… 46
Graph 3.2.3 ……… 47
Graph 4.1.1 ……… 49
Graph 4.1.2 ……… 50
Graph 4.1.3 ……… 51
Graph 4.2.1 ……… 53
Graph 4.2.2 ……… 54
Graph 4.2.3 ……… 55
Graph 5.1 ……… 57
Graph 5.2 ……… 59
Graph 5.3 ……… 60
Graph 5.1.1 ……… 61
Graph 5.1.2 ……… 62
Graph 5.1.3 ……… 63
Graph 5.2.1 ……… 65
Graph 5.2.2 ……… 66
Graph 5.2.3 ……… 67
Graph 5.3.1 ……… 68
Graph 5.3.2 ……… 69
Graph 5.3.3 ……… 70
Graph 5.4.1 ……… 71
ii
Graph 5.4.2 ……… 72
Graph 5.4.3 ……… 73
Graph 5.4 ……… 74
Graph 5.5 ……… 75
Graph 6.1 ……… 76
Graph 6.2 ……… 77
Graph 6.3 ……… 78
Graph 6.4 ……… 81
Graph 6.5 ……… 82
Graph 6.6 ……… 83
Graph 6.7 ……… 84
Graph 6.8 ……… 86
Graph 6.9 ……… 87
Graph 6.10 ……… 89
Graph 6.11 ……… 91
Graph 7.1 ……… 93
Graph 7.2 ……… 94
Graph 7.3 ……… 96
Graph 7.4 ……… 97
Graph 7.1.1 ……… 99
Graph 7.1.2 ……… 100
Graph 7.1.3 ……… 101
Graph 7.1.4 ……… 102
Graph 7.2.1 ……… 105
Graph 7.2.2 ……… 106
Graph 7.2.3 ……… 107
Graph 7.2.4 ……… 108
Graph 7.3.1 ……… 111
Graph 7.3.2 ……… 112
Graph 7.3.3 ……… 113
Graph 7.3.4 ……… 114
Graph 7.4.1 ……… 117
Graph 7.4.2 ……… 118
Graph 7.4.3 ……… 119
Graph 7.4.4 ……… 120
Graph 7.5.1 ……… 123
Graph 7.5.2 ……… 124
Graph 7.5.3 ……… 125
Graph 7.5.4 ……… 126
Graph 7.5 ……… 128
Graph 7.6 ……… 130
Graph 7.7 ……… 132
iii
List of Tables
Table A ……… 8
Table B ……… 13
Table C ……… 39
Table E ……… 80
Table F ……… 82
Table G ……… 84
Table H ……… 85
Table I ……… 85
Table J ……… 88
Table K ……… 90
Table L ……… 91
Table M ……… 131
Table A1 ……… 138
Table A2 ……… 139
Table A3 ……… 140
Table A4i ……… 141
Table A4ii ……… 142
Table A5i ……… 143
Table A5ii ……… 144
Table A6i ……… 145
Table A6ii ……… 146
Table A7i ……… 147
Table A7ii ……… 148
Table A8i ……… 149
Table A8ii ……… 150
Table A9 ……… 151
Table A10i ……… 152
Table A10ii ……… 153
Table A10iii ……… 154
Table A10iv ……… 155
Table A11 ……… 156
Table A12i ……… 157
Table A12ii ……… 158
1
1 Introduction
Innovation arises through the (re-)combination of knowledge – often through combination of new with existing knowledge. Hence, it is not surprising that private enterprises are opening up their innovation processes to external partners, including public research organizations. The literature on open innova- tion activities shows that such activities can increase the innovation performance of enterprises (Beck and Schenker–Wicki, 2014; Chesbrough, 2006; Laursen and Salter, 2006; Trantopoulos et al., 2017).
However, it is unclear under which circumstances knowledge and technology transfer (KTT) with the public research sector plays an important role for private innovation activities and whether it contrib- utes to the competitiveness of the enterprises. Past studies for Switzerland showed that KTT has the potential to increase innovativeness and labour productivity of transfer active enterprises (Arvanitis et al., 2008b, 2008c; Arvanitis and Woerter, 2009).
Since these studies have been conducted, the economic environment has changed substantially. For instance, Switzerland went through a phase of strong currency appreciation, which had a significant impact on the R&D investments of most enterprises (Kaiser et al., 2018). Moreover, the innovative enterprises in Switzerland are exposed to fierce international technological competition, which has accelerated even more with the rise of artificial intelligence (AI). In addition, the recent disruptions in international trade, in particular between the USA and China, will affect the profitability of the inno- vation activities of many enterprises, since frictionless access to international markets is an important driver for innovation.
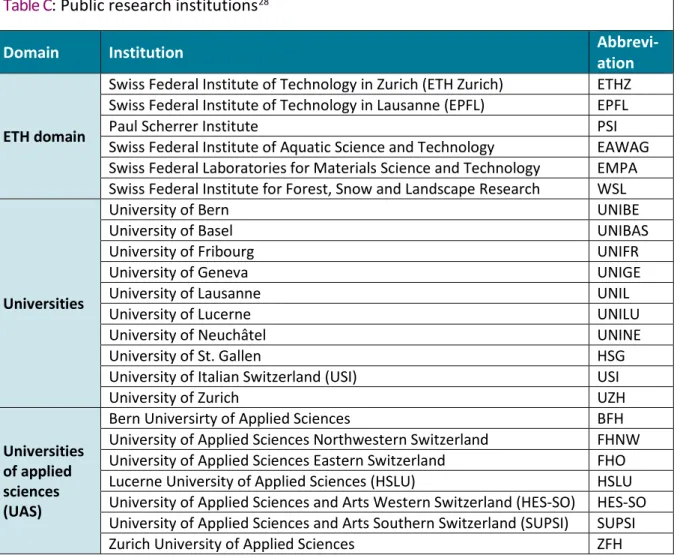
Against this background, the study at hand investigates the role of KTT with public research institutions for the innovation activities of Swiss firms. More concretely, we investigate the diffusion of knowledge and technology transfer between the Swiss public research sector, comprising universities, federal technical universities (ETH-Domain), the universities of applied sciences, and research organization ac- cording to Art. 15 FIFG
1(Inspire, CSEM, etc.), and, on the other hand, the private enterprise sector. We also reveal the characteristics of KTT active enterprises, the motivation of enterprises to pursue KTT, and the greatest obstacles to start KTT or to intensify KTT. Moreover, we provide some first economet- ric estimations in order to investigate the influence of the enterprises’ absorptive capacity (Cohen and Levinthal, 1990) for commercially successful KTT, the importance of international KTT activities, and the role of the enterprise organization (e.g. a vibrant innovation culture) for an effective transfor- mation of public research knowledge into marketable goods and services. An in-depth analysis of the obstacle profiles of KTT-active and -inactive enterprises also allows for some first hints at possible gov- ernmental interventions to improve the interface between the public research sector and private en- terprises.
This empirical analysis of the KTT activities of enterprises in Switzerland was conducted on behalf of the State Secretariat of Education, Research, and Innovation (SERI). The empirical analyses are based on a representative survey among Swiss enterprises with more than five employees comprising the manufacturing, construction, and service sector. The KOF Swiss Economic Institute has conducted such a survey for the third time already. In addition to the most recent survey wave in 2018, there have been surveys in 2005 and 2011. All surveys are based on the KOF enterprise panel, which ensures comparability of the data on KTT across time.
1
Federal Act on the Promotion of Research and Innovation (RIPA). It comprises institutions that should encourage scientific research, sci-
ence-based innovation, and support the exploitation of research results.
2 In accordance with Dosi (1982), we define knowledge and technology transfer between academic in- stitutions and the enterprise sector as any activity aimed at transferring knowledge or technology that may help either the company or the academic institute – depending on the direction of transfer – to further pursue its activities. Thus, we investigate KTT in a broader sense, comprising different «transfer forms» like informal contacts (e.g. attending scientific conferences, citation of scientific publications), education and mobility related forms (e.g. contact of recruited university graduates with their labora- tories at the universities, assignment of dissertations in cooperation with universities), research con- tracts, and consulting activities (see Illustration 1).
In summary, our analyses show the following results: We observe an increase in KTT active companies in the manufacturing sector and among large companies. Informal transfer contacts and education and training activities remain the most important categories of KTT forms. Technology transfer offices and the Swiss innovation funding organization (Innosuisse) gained in importance as mediators and promot- ers of transfer activities. Institutions of the ETH-Domain and Universities of Applied Sciences are the most frequent public transfer partners. Financial motives (e.g. lack of financial resources, time savings in R&D) have lost importance over time. Access to «tacit» knowledge (i.e. specific embodied knowledge) remains the most important motive for KTT. KTT active enterprises are characterised by higher R&D expenditures, higher educational levels of the employees, an open innovation culture, and export activities. KTT also affects the commercial performance of the enterprises. KTT activities are positively related to an increase in innovativeness and the commercial success of innovative products.
The latter, however, requires some specific in-house preconditions: enterprises have to invest suffi- cient amounts of R&D in order to benefit from the transferred knowledge. They need to have «absorp- tive capacity» for the research activities in public research institutions. Positive innovation perfor- mance effects of KTT activities are also evident in enterprises that combine national and international KTT activities. The organization of an enterprise is important for the transfer success, too. Enterprises in which innovation impulses are initiated top-down and bottom-up show a higher success rate in their innovation activities.
Potential measures to support KTT and to improve commercial results should prioritize attractive framework conditions. An economic environment that stimulates private investments in R&D activities would increase the absorptive capacity of enterprises, raise their probability to engage in KTT, and improve the expectations for successfully marketable products and services. Such generally positive framework conditions for innovation performance could be complemented by specific impulses that take into account the KTT obstacle profile of enterprises. This study shows that enterprises often lack the preconditions for KTT activities; for instance, they are not interested in research projects, or they think that their research questions would not be interesting for the scientific partner. R&D active en- terprises that are not engaged in KTT also locate deficiencies at public research institutions. More con- cretely, they lack information about public research activities, they have difficulties finding suitable contacts at the public research institutions, they detect a lack of entrepreneurial spirit, and they think that secrecy of the internal know-how of the enterprise is hardly guaranteed in such collaborations.
Moreover, they assume different priorities between the partners might hinder the transfer success.
The report is structured as follows: In section 2, we introduce the conceptual framework of this study.
There we present a graph that gives an overview about the topics we will address. It also contains
3 references to the relevant literature. Section 3 shows gives a brief overview of the data, while in sec- tion 4, we conduct the main analyses and present the results. This section includes information about the incidence of KTT in Switzerland, the applied transfer forms, and an overview of the transfer part- ners and the role of mediators. Moreover, it also contains the most important drivers for KTT activities, the outcomes of KTT activities, and some policy implication, which are also based on the analyses of the perceived transfer obstacles of the enterprises.
Finally, we want to take the opportunity to thank Dr. Müfit Sabo (SERI) and Daniel Dossenbach (SERI)
for their competent accompaniment of the study. We are grateful to all the enterprises that answered
our surveys and made this study possible in the first place. Our thanks also go to Gilles Aubert, who
contributed with great dedication and professionalism to the successful realization of the survey. A
short version of this comprehensive report will be published in the report «Research and Innovation
in Switzerland 2020» published by SERI.
4
2 Conceptual framework
2.1 Literature and analytical framework model
Illustration 1 depicts the conceptual model of knowledge and technology transfer between enterprises and scientific partners. This model emerges from the synthesis of the existing literature (see for instance, Arvanitis et al., 2005; Bozeman, 2000; Todd Davey et al., 2018). Our conceptual model follows recently developed frameworks that perceive the KTT from an integrated perspective consisting of a series of related elements, where the most relevant ones are: the KTT process, influencing factors – such as motives and impediments, supporting mechanisms – such as KTT mediators and the framework conditions (Campanella et al., 2017; Galan-Muros and Davey, 2017).
Our conceptual model serves two primary purposes: First, it structures the upcoming analysis, and second, it provides a mental guideline for the reader throughout this analysis.
In this spirit, the study analyzes specific parts of this model in single sections that can be put into per- spective by the reader with the help of the depiction above. At the central core of the model, the bidirectional arrow reflects the transfer of knowledge and technology between the two parties of in- terest: the private enterprise sector and the public research sector (scientific partners). These bidirec- tional KTT activities can be manifold and are grouped in into five categories («informal contacts», «in- frastructure», «education & mobility», «research» and «consulting») according to conceptual work (Galan-Muros and Davey, 2017; Meyer-Krahmer and Schmoch, 1998) and previous empirical studies in this field (Arvanitis et al., 2005, 2008c; Arvanitis and Woerter, 2015).
Both KTT partners have motives for and impediments against KTT activities (Arvanitis et al., 2008a;
Bayona et al., 2001; Hagedoorn, 1993). The above-depicted model categorizes the motives into four groups («tacit knowledge», «codified knowledge», «financial motives», and «institutional / organiza- tional motives») and the impediments into five groups («missing information», «lack of requirements on the side of the enterprise» or «the public research institution», «risks / costs»-related impediments, and «organizational/institutional factors»). Since this study takes on the enterprises’ point of view, these categories correspond to the motives and impediments of an enterprise.
The characteristics and attributes of both enterprises and public research institutions such as resources and assets influence the motives and impediments to conduct KTT alike (Arora and Cohen, 2015;
Arvanitis, 2012; Bekkers and Bodas-Freitas, 2010; Filippetti and Savona, 2017; Hall et al., 2001). For
instance, a lack of KTT specialists at the public research institution hampers an enterprise to conduct
KTT. Likewise, a shortage of human capital induces an enterprise to engage in KTT in order to raise its
human capital stock (Teirlinck and Spithoven, 2013). Furthermore, these attributes also influence
which scientific partner is targeted for KTT activities and which transfer forms are chosen. Similarly,
the corporate strategy, the organizational structure and processes as well as the innovation culture of
a company is not only related to the probability that transfer contacts exist, but also to the choice of
the form of transfer activities (Bercovitz and Feldman, 2007; Lin, 2007). Enterprises with a pronounced
innovation strategy could opt for more intensive forms of transfer, such as R&D consortia with univer-
sities, while enterprises without such strategies would only have occasional and more informal contact
with universities (Vuola and Hameri, 2006). Recruiting graduates or staff of the public research institu-
tion increases the stock of knowledge (Bolli et al., 2018; Protogerou et al., 2017; Thornhill, 2006; Zucker
et al., 1997).
5
Illustration 1 : Conceptual framework
6 To the right and left of the model, we see the output and outcomes of the KTT activities of both parties.
They comprise R&D projects, product and process innovations, licenses, patents, productivity, reve- nue, profits, and impact on society on the enterprises side. On the other side, a public research insti- tution’s outcomes comprise embodied knowledge, publications, patents, licenses, spin-off, the re- search and education quality and quantity, and the impact on society. These are indicators of a variety of important outcomes of transfer activities (Galan-Muros and Davey, 2017; Guerrero et al., 2015).
They are direct results of these KTT activities, or they are influenced by the KTT activities between enterprises and their scientific partners. Literature has studied the effects of KTT on firm performance mostly in forms of isolated activities such as commercialization through patents, licenses and spin-outs (Hagedoorn et al., 2018; Shane, 2004; Steenhuis and De Bruijn, 2002) as well as cooperative R&D (Bekkers and Bodas-Freitas, 2010; Perkmann et al., 2011; Veugelers and Cassiman, 2005), and has of- ten been dominated by literature from the US (Foray and Lissoni, 2010; Hall, 2004; Perkmann and Walsh, 2007; Teixeira and Mota, 2012). The empirical literature usually finds a positive relationship between KTT activities and innovation performance indicators. Based on direct measures for KTT ac- tivities, like R&D collaboration or universities as an important external knowledge source, transfer ac- tivities are positively correlated with the propensity to innovate, the number of patent applications, R&D intensity, or the introduction of product and process innovations and the sales share of innovative products (see e.g. Becker, 2003 and Fritsch and Franke, 2004 for Germany; Lööf and Broström for Sweden, 2008; Monjon and Waelbroeck, 2003 for France). Adams et al. (2003) found that cooperative R&D agreements stimulated industrial patents for company-financed R&D in industrial labs. However, Mohnen and Hoareau (2003) in a study based on pooled data for France, Germany, Ireland, and Spain found a positive relationship between cooperation with research institution and the propensity of pa- tenting, but not with the R&D intensity of an enterprise. For Switzerland Arvanitis et al. (2008a, 2008b) reported that KTT in general and research-intensive transfer forms in particular, are positively related with the innovation performance of an enterprise. Empirical studies that investigated the effects of KTT on economic performance indicators, like labor productivity, sales productivity or sales growth also found a positive relationship (e.g. Arvanitis et al., 2008b for Switzerland; Belderbos et al., 2004 for the Netherlands; Branstetter et al., 2005 for the U.S.).
The KTT intermediators and promoters work on reducing the impediments and obstacles of both par- ties in order to induce them to conduct KTT or to incentivize their already existing transfer activities (Todd Davey et al., 2018). We distinguish between the five above-mentioned types of mediators on national (TTOs, SNSF, Innosuisse) as well as international levels (EU Framework Programmes, other EU research programs).
The entire model is embedded into framework conditions that govern the possibilities of knowledge and technology transfer activities. According to literature important framework conditions are intel- lectual property rights, innovation promotion, regulations, international agreements, the labor market conditions and cultural influences (Bozeman, 2000; Todd Davey et al., 2018).
At last, two things are worth stressing out. First, it is important to see that this model stylizes the relationship between an enterprise and scientific partners and it does not rule out multiple KTT-rela- tionships. In fact, transfers between the public and private sector may complement knowledge and technology transfers between multiple enterprises and vice versa. However, we focus on public-pri- vate knowledge and technology transfer decoupled from other knowledge and technology transfers.
Only our econometric estimations consider other transfer activities to some extent. Secondly, the bi-
directionality of the transfer is important. Although some forms of public-private knowledge and tech-
nology transfer seem as if they are a flow from the public research institutes towards the private sec-
tor, it is very hard and probably inaccurate to think of this as a unilateral flow. For instance, consulting
7 activities of public research institutions to a private enterprise, which compensates its partner finan- cially, but additionally gives the consultants insights into the company and their industry. Although this reverse flow of knowledge might not be the primary target of these consulting activities, it is still a by- product of these KTT activities that can hardly be disentangled. A more obvious example for a bidirec- tional transfer of knowledge and technology is «research co-operation». If employees of private en- terprises work together with the staff of public research institutions on a joint research project, an open exchange of knowledge and technologies to achieve the same goals is indispensable. More gen- erally, both parties will have incentives to enter into these knowledge and technology transfer activi- ties. Therefore, most transfer activities result in a bidirectional flow of knowledge.
2.2 Structure of the analysis
Although the model is of a more general nature, we analyze this form of knowledge and technology transfer from an enterprise’s point of view. Section 4.1 answers questions with regard to enterprise indicators of KTT. More specifically, it will analyze what portion of enterprises conducts KTT (Section 4.1.1), which forms of KTT are cherished most by enterprises (Section 4.1.2), which scientific partners are targeted by enterprises to conduct KTT (Section 4.1.3) and which mediators and promoters of KTT are most relevant (Section 4.1.4). Referencing the conceptual model, the first section of analysis will consider the central horizontal axis of enterprises, scientific partners and the bidirectional arrow of knowledge and technology transfer together with some inspection of the KTT mediators. Section 4.2 will tackle the question of what drives enterprises to conduct KTT. This twofold analysis will first center on the motives to conduct KTT reported by enterprises (Section 4.2.1) and then on specific enterprise characteristics that are associated with higher probabilities to be KTT active (Section 4.2.2). Section 4.3 focuses on the outcomes of KTT for enterprises. Again, this is divided into a section that analyzes the results reported by the enterprises (Section 4.3.1) and a section that considers factors related to KTT which are correlated with higher productivity of the enterprise (Section 4.3.2). Finally, Section 4.4 dis- cuses policy implications with respect to perceived impediments of KTT from the enterprise’s side (Sec- tion 4.4.1) and their determinants (Section 4.4.2) as well as the role of intermediaries (Section 4.4.3).
All things considered, our analysis will cover the entirety of the conceptual model from an enterprises
point of view. That is, we do not analyze the incidence of KTT for public research institutions and nei-
ther their motivations and impediments to conduct KTT as well as how KTT is related to their outcomes.
8
3 Data and methods
The data for this report were collected through written surveys in 2005, 2011 and 2018. The surveys were based on the KOF Enterprise Panel, which is a stratified random sample of all enterprises in the Swiss economy with more than 5 employees. Since the KOF Enterprise Panel is regularly updated on the basis of the population of enterprises as collected by the Federal Statistical Office (FSO), it provides an adequate representation of the entire Swiss economy. The response rates to the three knowledge and technology transfer surveys ranged from 26% (2018) to 45% (2005). In total, we have an unbal- anced panel of 6163 enterprises available for the statistical analysis. In order to take into account pos- sible distortions by enterprises that did not respond to the surveys, we contacted each time a random sample of 500 non-responding enterprises in a series of separate telephone interviews. The answers collected through these non-response analyzes were subsequently integrated into the weighting schemes used in the statistical analysis.
The stratification of the KOF Enterprise Panel takes place on the level of 34 indus- tries, categorized into three sectors and four subsectors (see Table A), and 3 size classes, which results in a total of 34*3=102 cells. Within each of these 102 cells, enterprises are drawn randomly.
The stratification of the KOF Enterprise Panel also allows to make statistical statements about enterprises active in in- dustries with relatively small numbers. A simple random sample would primarily contain small enterprises from industries with high numbers of enterprises. More- over, a stratified random sample allows, if optimally drawn, a marked reduction in the estimated standard errors of all sta- tistics.
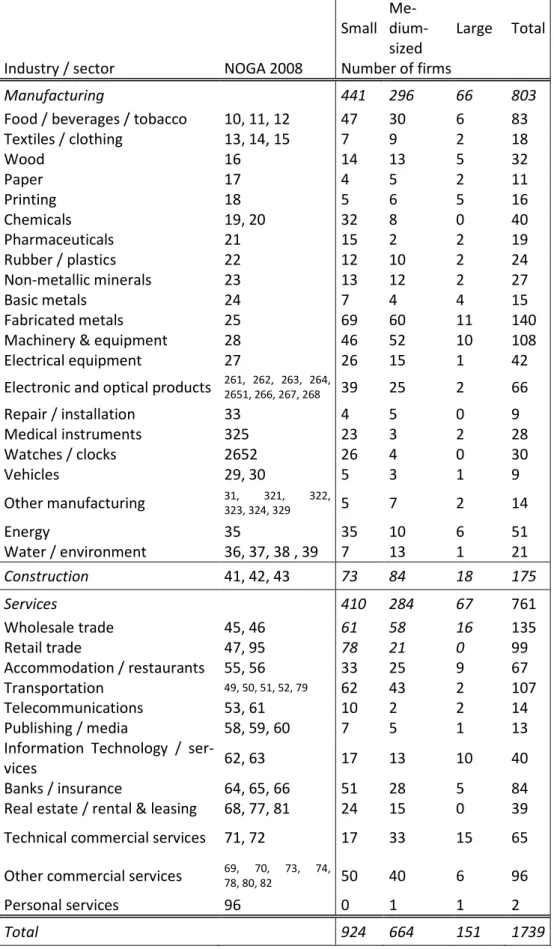
The structure of the KOF Enterprise Panel is shown in Table A2 in the appendix. It served as the basis for the 2018 survey. A total of 6’589 questionnaires were sent to the enterprises. Table A2 depicts the 34 industries on the Y-axis and the 3 industry specific size classes on the X-axis. For example, we sent 402 questionnaires to «Machinery & Equipment»: 168 to small enterprises, 208 to medium sized en- terprises, and 26 to large enterprises. In contrast, Table A1 in the appendix displays the number of questionnaires actually sent back to KOF, which totaled at 1739. To stick with the example of «Machin- ery & Equipment», we received answers from 108 enterprises: 46 from small enterprises, 52 from medium sized enterprises, and 10 from large enterprises. Table A3 in the appendix shows the response rates of the 102 cells, that is, the number of responses divided by the number of questionnaires sent.
The total response rate for the 2018 survey was 26.4%. In «Machinery & Equipment», the response rate reached a total of 26.9%: 27.4% for small enterprises, 25.0% for medium-sized enterprises, and 38.5% for large enterprises, respectively.
2
The definition of the industries is based on the 2-digit NOGA classification (see https://www.bfs.admin.ch/bfs/de/home/statis-
tiken/industrie-dienstleistungen/nomenklaturen/noga/publikationen-noga-2008.html).Table A: Subsector composition
2High-tech manufacturing industries
Chemicals, Pharmaceuticals, Machinery & equipment, Electrical equipment, Electronic and optical products, Medical instruments, Watches / clocks, Vehicles
Low-tech manufacturing industries
Food / beverages / tobacco, Textiles / clothing, Wood, Paper, Printing, Rubber / plastics, Non-metallic minerals, Basic metals, Fabricated metals, Repair / installation, Other manufacturing, Energy, Water / environment Modern industries
Telecommunications, Publishing / media, Information technology / services, Banks / insurance, Technical com- mercial services, Other commercial services
Traditional service industries
Wholesale trade, Retail trade, Accommodation / restau-
rants, Transportation, Real estate / rental & leasing, Per-
sonal services
9 In order to reverse the stratification of the panel, we rely on sampling weights. Again, this enables us to make statements about the entire economy. Statistics drawn from the stratified random sample would be biased towards an overrepresentation of enterprises from cells with low population num- bers.
For every enterprises i in cell h (h=1,2,…,102) a weight w
hiis defined:
w
hi= 1/f
h= 1/(n
h/N
h) = N
h/n
hwhere f
h: sampling rate of cell h
n
h: number of enterprises in cell h of sample N
h: number of enterprises in cell h of population
Non-response rate: For every enterprise i in cell h a weight 1/r
hiis defined, where r
hiis the probability that the enterprise i responds. This probability is in general unknown and is estimated by a binary (Probit-) model of the non-response rate on the structural characteristics of the enterprises (industry, size class, region, and language). Under consideration of the probability that enterprise i responds, the weight looks as follows:
w
hi*= w
hi1/r
hi10
4 Analysis
4.1 Indicators of KTT
This chapter is concerned with the question who conducts knowledge and technology transfer (Chap- ter 4.1.1) with which scientific partners (Chapter 4.1.3) and which transfer forms are preferably used by the enterprises (Chapter 4.1.2). Furthermore, it also sheds light on which mediators are the most relevant for the private sector (Chapter 4.1.4).
4.1.1 Incidence
This subchapter sheds light on the incidence of KTT in the Swiss private enterprise sector. In other words, we focus on the fraction of enterprises that conducted KTT in a certain period either with na- tional or international scientific partners and overall.
Graph 1.1: Incidence of knowledge and technology transfer, overall
3Note: This graphic shows the fraction of enterprises that were engaged in knowledge and technology transfer activities with scientific partners during the three survey periods.
Basis: All enterprises
Source: KOF-KTT surveys (2005, 2011, 2018)
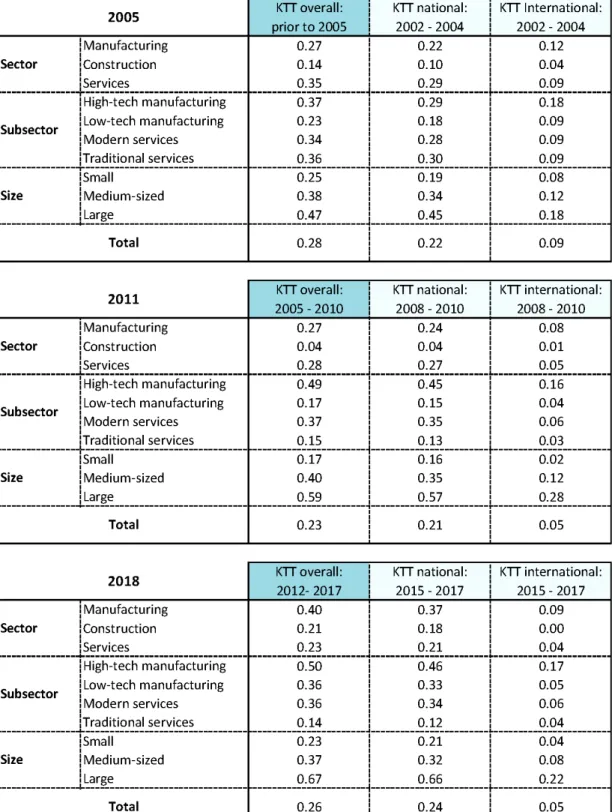
Graph 1.1 shows this information for all enterprises in the three survey periods
4. If we look at the overall KTT incidence - which comprises any KTT activities in these survey periods be it of national or interna- tional nature - we notice two things. About a quarter of all enterprises conduct some sort of KTT with
3
The exact numbers that this graph is based on can be found in Table A4i on page 141 in the appendix
4
The observation of transfer activities covers the 6 years prior to the survey year. E.g., the survey period corresponding to the
2018 survey covers the period from the beginning of 2012 to the end of 2017. A slight exception is the 2005 survey. The corre-
sponding questionnaire, as do all others as well, divided the questions of KTT activity into two parts. One that covers the previ-
ous 3 years and another that covers everything before 2002. As such, the 2005 survey period covers a much broader and not
exactly defined period. However, as we observed from the other two surveys most enterprises tend to ignore this time differenti-
ation and only answer whether they conducted KTT by crossing the box corresponding to the latter period. This yielded signifi-
cantly higher incidences of KTT for the prior 3 years compared to the 3 years before that. This occurrence was so systematical
11 scientific institutions and this fraction is fairly stable over the three periods. Most of these transfers are in co-operation with national scientific institutions and only a small fraction of enterprises conducts KTT with scientific partners abroad. We also note that the fraction of enterprises that conduct inter- national KTT is slightly decreasing over time. In fact, it is almost cut in half (from 9% in 2005 to 5% in 2018, see Table A4i in the appendix). In contrast, between a fifth and a quarter of all enterprises conduct national KTT. This fraction is quite constant over time.
Graph 1.2 shows the incidence of KTT in the three sectors manufacturing, construction and services and in the four subsectors high-tech and low-tech manufacturing as well as modern and traditional ser- vices
5.
Overall, the incidence of KTT strongly increased in manufacturing over time and especially in the last survey period (+13% points). This increase is also observable in the two subsectors of high-tech and low-tech manufacturing. The low-tech subsector drives the strong increase in the last survey period in manufacturing (+19% points). The raise of the incidence in the high-tech subsector, on the other hand, primarily happens between the 2005 and 2011 survey periods (+12% points). In terms of levels, the high-tech manufacturing subsector is by far the most KTT active. In 2018, half of all enterprises were engaged in some sort of KTT with scientific partners. In contrast, only about a third of all low-tech manufacturing enterprises were engaged in KTT between 2012 and 2017.
The service sector shows the exact opposite trend of manufacturing. The fraction of enterprises that were engaged in any KTT activity with scientific partners steadily declines over the years. The fraction of enterprises that conducted any form of KTT activities with scientific partners sinks from over a third in the 2005 period to under a quarter. The traditional services subsector clearly drives this decline. The incidence in this subsector dropped by 22% points between the first and the last survey period. The modern services subsector, on the other hand, shows a different picture. Its fraction of KTT-active enterprises is completely stable over time at around a third.
The construction sector has the lowest incidence of KTT overall. It also shows no specific trend. While there is an initial decrease in the fraction of KTT active enterprises (-10% points) this fraction increased between the 2011 and the 2018 survey periods (+17% points). This recent increase is so strong that the incidence of KTT overall in 2018 is practically similar in the construction (21%) and service (23%) sectors.
These developments hardly differ for national KTT. For all sectors and subsectors, the previously de- scribed facts for the overall KTT activities apply in the exact same manner to the national KTT activities.
The only difference is that the national KTT values are slightly below the overall values. The high-tech manufacturing subsector shows the biggest discrepancy between those two variables. This means, that this subsector has the highest fraction of enterprises that solely conduct KTT with international scien- tific partners. In fact, this subsector also records the highest fraction of enterprises that conduct inter- national KTT (over 15%). All other sectors or subsectors have a low and declining fraction of enterprises conducting international KTT.
such that there are only few meaningful interpretations. First, the enterprises do not instantly recall their activities that dated back for longer than 3 years or secondly, they simply ignore the time differentiation. An interpretation that KTT activities have a 3-year cyclicality is highly implausible. With this in mind, the inexactly defined prior period in the 2005 survey does not matter for the analyzes. Based on this reasoning, we only report the 3 years prior to the survey year, once we distinguish between national and international KTT. The values for the earlier 3 years are hardly reliable estimates.
5
The 2005 values stemming from (Arvanitis, Kubli, Sydow, & Wörter, 2005) differ from the reported values in this study. The
differences are due to different industry classification standards (NOGA 2002 vs NOGA 2008). The composition of sectors and
subsectors from their 2-digit industries used in this study (NOGA 2008) is shown in Table A of Chapter 4.
12 Graph 1.2: Incidence of knowledge and technology transfer, by sector and subsector
6Note: This graphic shows the fraction of enterprises that were engaged in knowledge and technology transfer activities with scientific partners during the three survey periods.
Basis: All enterprises, by sector and subsector Source: KOF-KTT surveys (2005, 2011, 2018)
6
The exact numbers that this graph is based on can be found in Table A4i on page 141 in the appendix.
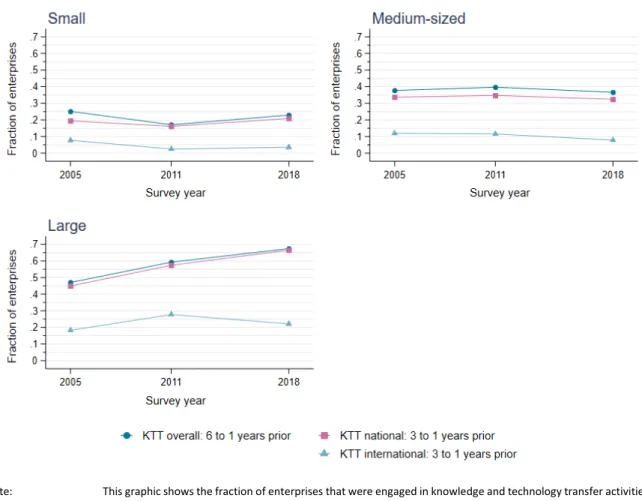
13 Graph 1.3: Incidence of knowledge and technology transfer, by enterprise size
7Note: This graphic shows the fraction of enterprises that were engaged in knowledge and technology transfer activities with scientific partners during the three survey periods.
Base: All enterprises, by enterprise size Source: KOF-KTT surveys (2005, 2011, 2018)
Finally, Graph 1.3 shows the incidence of KTT by enterprise sizes (see Table B). The large enterprises stick out primarily. A staggering two-thirds of all large enterprises were engaged in KTT with scientific part- ners between 2012 and 2017. Almost as much of them were engaged in KTT with national scientific partners in this period. Furthermore, this fraction is steadily increasing over the three survey periods.
In fact, these fractions increased by 20% points between the first and the last survey period. Large enterprises are also the most active with respect to international KTT. Between a fifth and a quarter of large enterprises were collaborating with scientific institutions abroad.
International KTT activities also exist within medium- sized enterprises. Yet, the fraction of KTT activities with international scientific institutions is far lower than for large enterprises and slowly decreasing over time.
About a third of all medium-sized enterprises are en- gaged in national KTT. A slightly bigger fraction (5%
points) conducts any form of KTT with scientific part- ners. These fractions are stable over time.
7
The exact numbers that this graph is based on can be found in Table A4i on page 141 in the appendix.
8
We use the standard definition of enterprise size classes (see https://www.bfs.admin.ch/bfs/de/home/statistiken/industrie-
dienstleistungen/unternehmen-beschaeftigte/wirtschaftsstruktur-unternehmen/kmu.html).Table B: Enterprise size classification
8Small < 50 employees
(full time equivalents) Medium-sized 50 to 250 employees
(full time equivalents) Large >= 250 employees
(full time equivalents)
14 At last, small enterprises do not rely heavily on international scientific institutions. The fraction of en- terprises that were active in these transfers has fallen from 8% to 4% over the three survey periods.
Small enterprises also record the lowest level of activities of national KTT and KTT overall. About a quarter of all small enterprises were conducting any form of KTT and about a fifth of small enterprises were engaged with national scientific partners. These numbers are lower in the 2011 period but re- covered in the final survey period.
Summarizing these insights, a substantial fraction of enterprises is active in KTT with scientific partners,
especially with national partners. The manufacturing sector records an increasing fraction of enter-
prises conducting national KTT (high-tech and especially low-tech) while the service sector records a
declining fraction, which is driven by enterprises in the traditional service subsector. The incidence of
national and international KTT is declining in enterprise size. These fractions are stable for small and
medium-sized enterprises while large enterprises show a strong increase in the fraction of enterprises
that conduct national KTT.
15
4.1.2 Forms
In this chapter, we investigate the forms of public-private knowledge and technology transfer. We an- alyze, which transfer forms are preferably used by private enterprises distinguishing between 19 single forms, which are categorized into five groups. In a first step, however, we concentrate on different categories of transfer forms and in a further step, we focus on individual forms.
4.1.2.1 Categories
Graph 2.1: Form categories of knowledge and technology transfer, overall
9Note: This graphic shows the fraction of enterprises that reported at least one single form of knowledge and technology transfer in the above mentioned categories as highly relevant (values >= 4 on a 5-point ordinal scale)
Basis: All enterprises that were engaged in knowledge and technology transfer activities with scientific partners during the three survey periods
Source: KOF-KTT surveys (2005, 2011, 2018)
Graph 2.1 depicts the fraction of all KTT-active enterprises that considered a category of transfer forms as highly relevant. More precisely put, it shows the fraction of enterprises that conducted knowledge and technology transfer with scientific institutions, which reported the values 4 or 5 on a 5-point ordi- nal scale for at least one single forms of a certain category.
For their knowledge and technology transfers with scientific institutions, private enterprises clearly value «informal contacts» and «education & mobility» above the rest. Over half of all KTT-active en- terprises reported these two transfer forms as highly relevant. «Research-based transfers», «consult- ing» and a shared «infrastructure» are all of minor importance. Only around 15% of all KTT-active en- terprises reported them as highly relevant. What sticks out as well is the fact that there are no trends.
The pecking order remains completely unchanged over the three survey periods and the fractions are fairly stable.
9
The exact numbers that this graph is based on can be found in Table A5i on page 143 in the appendix.
16 Graph 2.2: Form categories of knowledge and technology transfer, by sector and subsector
10Note: This graphic shows the fraction of enterprises that reported at least one single form of knowledge and technology transfer in the above mentioned categories as highly relevant (values >= 4 on a 5-point ordinal scale)
Basis: All enterprises that were engaged in knowledge and technology transfer activities with scientific partners during the three survey periods, by sector and subsector
Source: KOF-KTT surveys (2005, 2011, 2018)
10
The exact numbers that this graph is based on can be found in Table A5i on page 143 in the appendix.
17 Graph 2.2 shows the relevance of the five categories of transfer forms by sector and subsector. Again, the two most important transfer categories are «informal contacts» and «education & mobility», irre- spective of sector or subsector. However, there are differences across sectors and subsectors that are worth mentioning.
The fraction of KTT-active manufacturing enterprises that see «informal contacts» as highly relevant transfer forms is decreasing over time (-12% points). The high-tech manufacturing enterprises drive this reduction in the earlier survey periods (-12% points) while the low-tech manufacturing subsector drives this decrease in the latter survey periods (-10% points). However, in line with the overall picture, over half of the KTT-active manufacturing enterprises see «informal contacts» and «education & mo- bility» as highly relevant. This applies to the low-tech manufacturing subsector and especially to the high-tech manufacturing subsector. However, there is a slightly bigger fraction of KTT-active high-tech enterprises, which value «education & mobility» transfers over «informal contacts», while it is gener- ally the other way around. Furthermore, the manufacturing sector sets itself apart in its valuation of the other three categories of transfer forms. Especially the high-tech manufacturing subsector records between a quarter and a third of all KTT-active enterprises that see «infrastructure-based transfers»
and «research-based transfers» as highly relevant. No other sector or subsector shows this kind of valuation for these transfer forms.
The service sector closely resembles the overall picture. Over half of all enterprises engaged in KTT see
«informal contacts» and «education & mobility» as highly relevant transfer forms. The former category is slightly more important than the latter, except for the last survey period. The other three categories lag behind in terms of relevance by quite a lot. Only between 10% and 20% of all KTT-active service enterprises see these transfers as highly relevant. On a subsector level, the picture for «research-based transfers», «infrastructure-based» transfers», and «consulting» does not differ significantly. However, there is more time variation in the other two transfer categories. The relevance of «informal contacts»
is inverted u-shaped in the modern services subsector while it is u-shaped in the traditional services subsector. The maximum of the former subsector is at 81% of all enterprises engaged in KTT with sci- entific institutions while the minimum of the latter subsector is at 32% of all KTT-active enterprises, both recorded in 2011. In the other periods, both subsectors record between half and two-thirds of all KTT-active enterprises that assess «informal contacts» to scientific institutions as highly relevant. An- other picture evolves for «education & mobility». The traditional services subsector shows an inverted u-shaped relation over time with a peak fraction of 71% of all enterprises conducting KTT between 2005 and 2010 that saw these transfers as highly relevant. This corresponds to a 40% points increase to the preceding survey period. This fraction dropped in the latest survey period to roughly a half.
Modern services, on the other hand, show a slight decrease over time from 69% to 60% of all KTT- active enterprises.
The construction sector shows two distinct features. First, the fraction of KTT-active enterprises that see «education & mobility» as highly relevant transfer forms has decreased from 51% to 24%. Sec- ondly, it records a steadily increasing valuation of «consulting» from meagre 2% of all enterprises en- gaged in KTT in the 2005 period to 19% in the 2018 period.
Graph 2.3 shows the fraction of enterprises by enterprise size that reported at least one single form of
knowledge and technology transfer within one of the five categories as highly relevant. In general, the
picture is similar to the overall case and the one for sectors and subsectors. The most highly valued
categorized transfer forms are «informal contacts» and «education & mobility». The remaining three
categories of «research-based», «infrastructure-based», and «consulting-based transfer» lag behind
with respect to their relevance.
18 Graph 2.3: Form categories of knowledge and technology transfer, by enterprise size
11Note: This graphic shows the fraction of enterprises that reported at least one single form of knowledge and technology transfer in the above mentioned categories as highly relevant (values >= 4 on a 5-point ordinal scale)
Basis: All enterprises that were engaged in knowledge and technology transfer activities with scientific partners during the three survey periods, by sector and subsector
Source: KOF-KTT surveys (2005, 2011, 2018)
Over two-thirds of all large enterprises see «informal contacts» and «education & mobility» as highly relevant categories of knowledge and technology transfer. The relevance of «education & mobility»
even increased in the latest survey period. A staggering 83% of all large enterprises that conducted KTT with scientific institutions in that period reported this category of transfer forms as highly relevant.
We also note that «informal contacts» are very important to about 70% of all KTT-active large enter- prises, a fraction that is stable over time. The other transfer forms are not that important for large enterprises.
Small and medium-sized enterprises (SMEs) show a similar picture. «Informal contacts» and «educa- tion & mobility» are the predominant transfer forms, while the other three categories do not find as much appreciation. Only two things seem worth mentioning. The fraction of KTT-active small enter- prises that consider «informal contacts» important is greater than for «education & mobility». The exact opposite picture emerges for medium-sized enterprises; a larger fraction cherishes «education
& mobility» above «informal contacts».
Summarizing these insights, a clear picture emerges that seems to hold throughout the private sector, irrespective of sector subsector or enterprise size. The categories of «informal contacts» and «educa- tion & mobility» are the most highly valued categories of transfer forms with scientific institutions.
«Research-based» and «infrastructure-based transfers» as well as «consulting» lag behind with re- spect to their appreciation by enterprises engaged in KTT. Despite some notable exceptions, these valuations are stable over these three survey periods.
11
The exact numbers that this graph is based on can be found in Table A5i on page 143 in the appendix.
19 4.1.2.2 Single Forms
In the previous chapter, we investigated the importance of categorized single transfer forms. In this chapter, we take a step back and ask which single transfer form in a certain category is the most rele- vant. In this vein, we analyze each of the five categories of transfer forms and look at the fraction of KTT-active enterprises that report a specific single transfer form as highly relevant, starting with «in- formal contacts».
4.1.2.2.1 Informal Contacts
Graph 2.1.1: Single forms of knowledge and technology transfer in the category «Informal contacts», overall
12Note: This graphic shows the fraction of enterprises that reported a specific single form of knowledge and technology transfer in the category «Informal contacts» as highly relevant (values >= 4 on a 5-point ordinal scale)
Basis: All enterprises that were engaged in knowledge and technology transfer activities with scientific partners during the three survey periods
Source: KOF-KTT surveys (2005, 2011, 2018)
Graph 2.1.1 shows the fraction of enterprises engaged in KTT with scientific institutions in one of the three survey periods that reported a single transfer form in the category of «informal contacts» as highly relevant.
A first thing to note is that while between 50% and 65% of all KTT-active enterprises highly valued the category of «informal contacts» not one single transfer form in this category nearly reaches this num- ber. Furthermore, we can see that there are small differences in the fraction of enterprises that value a specific single form. The fraction of enterprises that participate in KTT and considers «conferences, exhibitions, and workshops» or «scientific publications» to be highly relevant, fluctuates over time by about 10% points around the baseline value of 30%. The fraction of enterprises that highly values «in- formal contacts to the staff of scientific institutions», however, is stable at 30% over the three survey periods.
12
The exact numbers that this graph is based on can be found in Table A5ii on page 144 in the appendix.
20 Graph 2.1.2: Single forms of knowledge and technology transfer in the category «Informal contacts», by sector and subsector
13Note: This graphic shows the fraction of enterprises that reported a specific single form of knowledge and technology transfer in the category «Informal contacts» as highly relevant (values >= 4 on a 5-point ordinal scale)
Basis: All enterprises that were engaged in knowledge and technology transfer activities with scientific partners during the three survey periods, by sector and subsector
Source: KOF-KTT surveys (2005, 2011, 2018)
13
The exact numbers that this graph is based on can be found in Table A5ii on page 144 in the appendix.
21 These two insights imply that all three single «informal transfer» forms are similarly relevant and most KTT-active enterprises spread their transfers over multiple «informal transfer» forms.
Graph 2.1.2 depicts the relevance of the three single informal transfer forms for KTT-active enterprises by sector and subsector over the three survey periods.
The manufacturing sector shows a stable development in the fraction of enterprises engaged in KTT that value the three single forms. There is a slightly negative trend in the relevance of «scientific pub- lications», especially in the last survey period (-11% points). In particular, the low-tech manufacturing subsector shows a strong decline in this transfer form in the last survey period (-20% points). About a third of all manufacturing enterprises conducting KTT see «informal contacts to the staff on scientific institutions» as highly relevant and about a quarter reports a high relevance of «conferences, exposi- tions, or workshops» at scientific institutions.
The service sector shows a similar picture, with exception of the 2011 survey period. Around 30% of all KTT-active enterprises see each of the three transfer forms as highly relevant. Between 2005 and 2010 we see an increasing importance in «conferences, expositions, and workshops» relative to the former (+12% points) and especially the latter (+19% points) survey periods. The modern services sub- sector clearly drives this temporary pattern.
Graph 2.1.3: Single forms of knowledge and technology transfer in the category «Informal contacts», by enterprise size
14Note: This graphic shows the fraction of enterprises that reported a specific single form of knowledge and technology transfer in the category «Informal contacts» as highly relevant (values >= 4 on a 5-point ordinal scale)
Basis: All enterprises that were engaged in knowledge and technology transfer activities with scientific partners during the three survey periods, by enterprise size
Source: KOF-KTT surveys (2005, 2011, 2018)
14
The exact numbers that this graph is based on can be found in Table A5ii on page 144 in the appendix.
22 The construction sector reports a steady increase in the fraction KTT-active enterprises emphasizing
«conferences, expositions, and workshops». «Scientific publications» have first fallen in importance and then risen again in the latter survey period. The opposite is true for «informal contacts».
This graph evidently shows that despite some fluctuations the three informal transfer forms are simi- larly important within each sector and subsector. Only the 2011 survey period shows an increasing dispersion in their relative relevance.
Graph 2.1.3 depicts the relevance of the three single informal transfer forms by enterprise size. Large enterprises show an interesting picture. Between the first two survey periods, the fraction of KTT- active enterprises that highly value a single transfer form was increasing for all three forms. The im- portance of «conferences, expositions, and workshops» kept on increasing in the last survey period (+10% points) while the importance of «scientific publications» (-11% points) and especially «informal contacts to the scientific institutions» (-15% points) declined.
Small and medium-sized enterprises (SMEs) are relatively similar. Around 30% of all KTT-active enter- prises see each single informal transfer form as highly relevant. Opposed to small enterprises, a smaller fraction of medium-sized enterprises sees «scientific publications» as highly relevant. The importance of the other two transfer forms are comparable across these enterprise sizes.
Bringing these insights together, we can say that the valuation of the three single informal transfer forms is narrowly dispersed within a certain sector, subsector as well as by enterprise size and overall.
Not a single transfer form systematically sets itself apart in terms of relevance from the other two.
Furthermore, most enterprises seem to appreciate more than one single informal transfer form. Some- how remarkable is the strongly increasing importance of «conferences, expositions, and workshops»
among large enterprises.
23 4.1.2.2.2 Infrastructure
In this chapter, we look at the single transfer forms in the overall less noticed category of «infrastruc- ture-based transfers». This category distinguishes between two single forms: «Shared laboratories»
and utilization of the «technical infrastructure» of scientific institutions.
Graph 2.2.1: Single forms of knowledge and technology transfer in the category «Infrastruc- ture», overall
15Note: This graphic shows the fraction of enterprises that reported a specific single form of knowledge and technology transfer in the category «Infrastructure» as highly relevant (values >= 4 on a 5-point ordinal scale)
Basis: All enterprises that were engaged in knowledge and technology transfer activities with scientific partners during the three survey periods
Source: KOF-KTT surveys (2005, 2011, 2018)
Graph 2.2.1 depicts the fraction of enterprises engaged in KTT with scientific partners in the three survey periods that highly valued a single «infrastructure-based transfer» form.
The previous analysis has shown that «infrastructure-based transfers» are less common overall. As such, it comes as no surprise that this is also true for the single forms in this category. Between 10%
and 15% of all enterprises engaged in KTT see the usage of the «technical infrastructure» of scientific partners as highly relevant transfer forms. «Shared laboratories» are an even less common transfer form. About 5% of all KTT-active enterprises reports them as highly relevant.
By comparing this to Graph 2.1 we also note that the values for usage of «technical infrastructure»
almost coincide with the ones for the category of «infrastructure-based transfers». This implies that almost all enterprises that report «shared laboratories» as highly relevant also report the usage of
«technical infrastructure» of the scientific partner as highly relevant.
15
The exact numbers that this graph is based on can be found in Table A5ii on page 144 in the appendix.
24 Graph 2.2.2: Single forms of knowledge and technology transfer in the category «Infrastruc- ture», by sector and subsector
16Note: This graphic shows the fraction of enterprises that reported a specific single form of knowledge and technology transfer in the category «Infrastructure» as highly relevant (values >= 4 on a 5-point ordinal scale)
Basis: All enterprises that were engaged in knowledge and technology transfer activities with scientific partners during the three survey periods, by sector and subsector
Source: KOF-KTT surveys (2005, 2011, 2018)
16
The exact numbers that this graph is based on can be found in Table A5ii on page 144 in the appendix.
25 Graph 2.2.2 depicts the relevance of single «infrastructure-based transfer» forms by sector and subsec- tor. In each sector and subsector, the usage of «technical infrastructure» is the dominant transfer form.
Furthermore, there are some fluctuations over time but overall the fraction of KTT-active enterprises within a sector or subsector that sees a single transfer form as highly relevant is stable over the three survey periods, especially for the less common «shared laboratories».
As is evident from Graph 2.2, the manufacturing sector shows the biggest fraction of KTT-active enter- prises that see «infrastructure-based transfers» as highly relevant. This must therefore also hold true for the single forms of this category. The usage of the «technical infrastructure» of the scientific part- ner is relevant in the manufacturing sector and especially in high-tech manufacturing.
For the enterprises in the service sector as well as the construction sector, these transfer forms are nearly irrelevant, particularly «shared laboratories». What sticks out, though, is that the traditional services subsector cherishes the usage of «technical infrastructure» more than the modern services subsector.
Graph 2.2.3: Single forms of knowledge and technology transfer in the category «Infrastruc- ture», by enterprise size
17Note: This graphic shows the fraction of enterprises that reported a specific single form of knowledge and technology transfer in the category «Infrastructure» as highly relevant (values >= 4 on a 5-point ordinal scale)
Basis: All enterprises that were engaged in knowledge and technology transfer activities with scientific partners during the three survey periods, by enterprise size
Source: KOF-KTT surveys (2005, 2011, 2018)
17
The exact numbers that this graph is based on can be found in Table A5ii on page 144 in the appendix.
26 Graph 2.2.3 reports the relevance of single «infrastructure-based transfer» forms by enterprise size.
Corresponding to the other two graphs, the usage of «technical infrastructure» is more important than
«shared laboratories». It is also the case that their valuation is unchanged over these survey periods.
Large and medium-sized enterprises have a slightly higher appreciation for the usage of «technical infrastructure» opposed to small enterprises. When it comes to «shared laboratories», no differences are evident across enterprise size.
Compressing these insights, we note three things. The usage of «technical infrastructure» is more im-
portant than «shared laboratories», irrespective of sector, subsector, or enterprise size. Additionally,
there are no trends. Otherwise put, the valuation for these two transfer forms is stable over the survey
horizon. Finally, almost all enterprises that highly value the usage of «technical infrastructure» also
cherish «shared laboratories». Since the fraction that appreciates the latter transfer form is extremely
small and since there are only two single forms in this category, this comes as no real surprise.
27 4.1.2.2.3 Education & Mobility
The category of «education & mobility» comprises nine different single forms: «Recruiting graduates from scientific institutions», «contact of employees with their prior scientific institution», «internships of students», «joint thesis», «joint dissertations», «collaboration with scientific institutions’ research- ers», «joint lectures», «lectureships of employees», and «advanced training of employees» at scientific institutions.
Graph 2.3.1: Single forms of knowledge and technology transfer in the category «Education
& mobility», overall
18Note: This graphic shows the fraction of enterprises that reported a specific single form of knowledge and technology transfer in the category «Education & mobility» as highly relevant (values >= 4 on a 5-point ordinal scale)
Basis: All enterprises that were engaged in knowledge and technology transfer activities with scientific partners during the three survey periods
Source: KOF-KTT surveys (2005, 2011, 2018)
Graph 2.3.1 depicts the fraction of KTT-active enterprises that see a specific single transfer form in the category of «education & mobility» as highly relevant.
Overall, two single forms are especially relevant: «advanced training of employees» at and «recruiting graduates» from scientific institutions. In this sense, enterprises are most interested in directly improv- ing their human capital. Besides these two transfer forms, all others are of relative similar importance.
Comparing this to Graph 2.1 we can also see that no other single form comes close to the values for the combined category of «education & mobility».
1918
The exact numbers that this graph is based on can be found in Table A5ii on page 144 in the appendix.
19
A minor exemption is the fraction of enterprises that report «advanced training opportunities» as highly relevant
in the 2011 period.
28 Graph 2.3.2: Single forms of knowledge and technology transfer in the category «Education
& mobility», by sector and subsector
20Note: This graphic shows the fraction of enterprises that reported a specific single form of knowledge and technology transfer in the category «Education & mobility» as highly relevant (values >= 4 on a 5-point ordinal scale)
Basis: All enterprises that were engaged in knowledge and technology transfer activities with scientific partners during the three survey periods, by sector and subsector
Source: KOF-KTT surveys (2005, 2011, 2018)
20