Migrant integration: Insights from Belgium, Italy, Spain and Germany
Christina Boll, Andreas Lagemann, Achim Welsch, André Wolf
Paper 127
HWWI Policy
The authors are solely responsible for the contents which do not necessarily represent the opinion of the HWWI.
Corresponding author:
Dr. André Wolf
Hamburg Institute of International Economics (HWWI) Oberhafenstr. 1 | 20097 Hamburg | Germany
Telephone: +49 (0)40 340576-665 | Fax: +49 (0)40 340576-150 wolf@hwwi.org
HWWI Policy Paper
Hamburg Institute of International Economics (HWWI) Oberhafenstr. 1 | 20097 Hamburg | Germany
Telephone: +49 (0)40 340576-0 | Fax: +49 (0)40 340576-150 info@hwwi.org | www.hwwi.org
ISSN 1862-4960
© Hamburg Institute of International Economics (HWWI) | October 2020 All rights reserved. No part of this publication may be reproduced, stored in a re- trieval system, or transmitted in any form or by any means (electronic, mechani-
HWWI Policy Paper 127
Migrant integration: Insights from Belgium, Italy, Spain and Germany
Christina Boll, Andreas Lagemann, Achim Welsch, André Wolf
Study of the Hamburg Institute of International Economics (HWWI) within the framework of MICADO and the EU Horizon 2020 programme
This project has received funding from the European Union’s H2020 Inno- vation Action under Grant Agreement No 822717.
Project MICADO: https://www.micadoproject.eu/about/
Content
1 | Introduction 3
2 | Migrant inflow and migrant stocks in the four-country comparison 5
2.1 | Inflow of migrants 5
2.2 | Migrant stocks: Migrant population compared to total population 6
2.3 | Demographic and macroeconomic conditions 9
3 | Structural indicators of migrant integration 12
3.1 | Employment 12
3.2 | Education 17
3.3 | Housing and living conditions 23
3.4 | Health 25
4 | Applicability of integration indicators at the local level 27 4.1 | Coverage in international macroeconomic databases 27 4.2 | Availability of local indicators at local statistical offices 27
4.3 | Different definitions 28
5 | Conclusion 29
6 | References 32
7 | Appendix 34
1 | Introduction
Several EU Member States have traditionally been a destination for migrants, whether they come from within the EU or elsewhere in the world. The flow of migrants has led to a range of new skills and talents being introduced into local labour markets while also increasing cultural diversity. The relevance of a stronger integration of migrants into the labour markets and societal lives of host countries exists from both a macroeconomic and an individual perspective. From a macroeconomic point of view, migrants represent a significant pool of skilled workers. As forecasts show, significant immigration may attenuate the decline in labour force potential (Fuchs et al. 2016), but this will only help mitigating labour bottlenecks if migrants are added to the workforce. The individual importance of labour market integration becomes particularly clear against the back- ground of the risk of poverty. For example, based on a nationwide analysis performed by the German Microcensus 2015, it can be seen that, compared with an at-risk-of-pov- erty rate of families without a migration background (13%), migrant families are much more at risk with a rate of 29% (BMFSFJ 2017a, p. 27).
Consequently, the integration of migrants has increasingly become a key area for policy focus in recent years, with measures to prepare immigrants and their descendants so they may participate more actively in society. The goal of the Zaragoza indicators, agreed by EU Member States in Zaragoza (Spain) in April 2010 (European Council 2010), is to further develop the core idea of integration as a driver for development and social cohesion.
The MICADO projects aims at improving the access to information about migrants for local authorities, in order to support measures for the integration process (see Box 1)
The MICADO project provides innovative communication and interaction tools for managing the integration of migrants in cities across the EU, to be piloted in Hamburg, Madrid, Bologna and Antwerp.
By using new technologies of data analysis and data integration on the one hand and easily accessible au- dio-visual interfaces on the other, MICADO will provide a technical solution to make arrival and participation processes more efficient. These systems should facilitate communication with and between local authorities and facilitate access to relevant information.
The user-oriented data services, which integrate both local and regional as well as national migration-related information, focus on the four areas of work, education, housing and health and the three target groups of migrants, local authorities and initiatives in the field of migration. The services will be developed and tested in co-creative processes in cooperation with the target groups.
MICADO is part of the EU research programme Horizon 2020. The consortium consists of 15 partners from five EU countries, including research institutes, public institutions and private companies.
More information: https://www.micadoproject.eu/
Box 1
Therefore, it is necessary to map the state of the art of existing integration statistics and subgroup-specific integration outcomes, for example, per educational level, citizenship, or country of birth, for the four countries whose pilot cities are involved in the MICADO project. Knowing (a) which data are available at different geographical levels, (b) what the integration outcomes are for each of the four countries based on these data and (c) the limitations of these data are three prerequisites to identify data requirements and adequate integration measures at a local level. At this level, digital tools that aim to better equip migrants, public authorities and helper organisations with reliable and suitable data to manage integration processes are to be developed and implemented in the MI- CADO framework.
Furthermore, some facts on recent migration trends, current migrant stocks and overall demographic and macroeconomic conditions in each of the four countries are considered necessary contextual information to better understand current challenges at a national level (d). The report at hand strives to provide the named prerequisites (a)-(d).
According to these four prerequisites, the remainder of this report is structured as fol- lows. Section 2 discusses types, paths and the current situation of migration flows, as well as demographic and macroeconomic conditions in the four MICADO countries:
Belgium, Spain, Italy, and Germany, including a look at the regional situation in and around the four pilot cities. Section 3 presents a detailed state of the art with respect to migrant integration, based on significant structural indicators. Section 4 analyses in how far these structural indicators are applicable to the local level. Section 5 concludes with several recommendations how to deal with certain data problems.
2 | Migrant inflow and migrant stocks in the four-coun- try comparison
In this study, we are concerned with movements across national borders. In this regard, our interest goes beyond the group of immediate movers, it also involves the subsequent generation, i.e. the children of movers raised in the receiving countries. By dealing with macro-level statistics, we have to cope with the issue that the population groups cannot be perfectly separated. One available indicator to identify movers in particular is infor- mation regarding the country of birth. In some cases of limited data availability, this study refers to the country of citizenship. In doing so, we additionally differentiate (wherever possible) between integration outcomes for EU and non-EU migrants, to il- lustrate the significant discrepancies in integration success between these groups. Fi- nally, we draw on (wherever possible) regional data (mostly NUTS-2) to illustrate re- gional specificities regarding the four pilot cities, while keeping in mind their limited comparability.
The extent to which migrant integration is successful is closely related to individual char- acteristics and contextual factors at a macroeconomic and societal level. Thus, before ex- ploring different aspects of migrant integration, the basic trends of migration in terms of flows (2.1) and stocks (2.2) as well as key macroeconomic and demographic features (2.3) will be presented for each of the four MICADO pilot countries.
2.1 | Inflow of migrants
In measuring migration, the evolution of annual inflows, i.e. the annual number of per- sons from abroad immigrating into a certain country, are of natural concern. With the exception of the 2009 and 2010, Germany stood out with the highest number of immi- grants in the four-country-comparison from 2008 to 2018 (see Figure 1). After the peak in 2015, caused by the opening of borders in the context of that year’s refugee crisis, immigration numbers were below the one-million threshold in 2017 and 2018. However, with 893,886 immigrants, the number was almost 1.4 times as high as in Spain, more than six times higher than in Belgium and roughly 2.7times higher than in Italy. While in Belgium the peak was less significant, no similar development can be observed for Italy and Spain. In these countries, immigration numbers have not yet fully recovered from the massive decline in 2009, in the context of the economic downturn following the financial crises. However, since 2015 an upward trend for immigration into these coun- tries can be noticed.
Figure 1: Cross-border immigration 2008-2018
Whereas in 2013 and 2014, migrants with EU-citizenship (‘EU migrants’) outnumbered those with non-EU citizenship (‘non-EU migrants’) in Germany the situation reversed in 2015, when the number of non-EU migrants peaked with 967,539 people. However, by 2018, the number of non-EU migrants registered in Germany (370,354) almost equalled the number of EU migrants (397,375). Belgium showed fairly low immigration numbers, compared to the other countries. The number of non-EU migrants in Belgium also peaked in 2015 and afterwards almost returned to the previous level, reaching 54,911 in 2018. Stateless people hardly played a role due to their scarceness (the same holds for people with unknown citizenship). In Spain and Italy, the number of non-EU migrants exceeded that of EU-migrants at any time. Whereas in Spain the number of non-EU mi- grants steadily increased during that time, the number of this group was stable in Italy.
In 2018, the numbers amounted to 228,117 in Italy and 414,292 in Spain (see Table 4 in the appendix).
2.2 | Migrant stocks: Migrant population compared to total population
In addition to migrant inflows, another measure of the intensity of immigration is the size of the migrant stock (i.e. the number of immigrants residing at a certain point in time in a host country) in relation to the host country’s total population size.
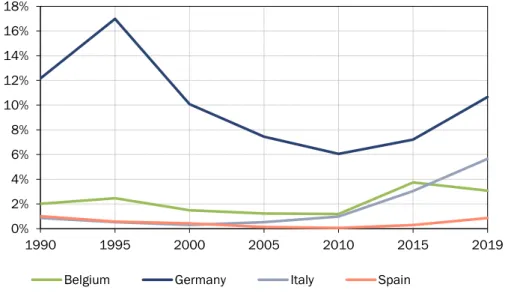
Belgium ranked first in 2019 as regards migrants’ share of the total population (see Fig- ure 2). Across time, this share increased in all four countries. While Belgium showed a modest increase from 12.8% to 17.2% in this period, the rate more than doubled in Ger- many from 7.5% to 15.7%. In Italy, the rate even quadrupled from 2.5% to 10.4%. In Spain, it was up to six times higher in 2019 (13.1%), compared to 1990 (2.1%), indicating a long-term trend towards intensified immigration in the latter two countries. In Spain and Italy, the increase was strongest between 2000 and 2010. After that, the economic downturn following the financial crisis seemed to bring this development to a halt. By
0 200 400 600 800 1.000 1.200 1.400 1.600 1.800
2008 2009 2010 2011 2012 2013 2014 2015 2016 2017 2018
Belgium Germany Italy Spain
Sources: Eurostat [migr_imm1ctz]; HWWI
in thousands
contrast, this was not the case for Germany. Moreover, it has experienced a particularly dynamic growth since 2015, mainly as a consequence of opening the borders during the refugee crisis. The trends hardly differ by the sex of the migrants. However, there are differences between countries regarding the overall share of females in the migrant stock. In Italy, females have consistently made up a clear majority for the past 30 years.
In the other three countries shares are closer to 50%. In Spain and Belgium, they have shown a slight upward trend in recent years, while the share in Germany has recently shrunk, probably due to the increased inflow of unaccompanied male refugees (see Ta- ble 5 in the appendix). The five main countries of citizenship and birth of the foreign/for- eign-born population are compiled in Table 6 in the appendix.
Figure 2: International migrant stock as a percentage of the total population
Escape motives have gained momentum among migrants since 2010 in Italy and Ger- many (see Figure 3). Also, in Belgium, the share of asylum seekers and refugees has modestly increased between 2010 and 2015 but decreased again in recent years. In Spain, however, at no time did this group represent more than 1% in this period of observation.
0%
2%
4%
6%
8%
10%
12%
14%
16%
18%
20%
1990 1995 2000 2005 2010 2015 2019
Belgium Germany Italy Spain
Sources: United Nations (2019); HWWI
Figure 3: Refugees and asylum seekers as a percentage of the international migrant stock
Regional dimension
Data availability seriously limits comparability at a regional or even city level in Europe.
One basic indicator that could at least be retrieved for all the pilot cities involved in MI- CADO is migrant share by nationality.
Figure 4 shows the most recent data concerning the share of foreign citizens in the total population in Antwerp, Hamburg, Madrid and Bologna. Antwerp has the highest share of individuals with foreign nationality, around 27%. Hamburg (17%), Madrid (16%) and Bologna (18%) show almost similar shares. These differences have to be interpreted bear- ing in mind the economic and legal background in the corresponding countries. Not only does the economic situation as an important pull factor for migrants differ between the countries involved, but the conditions under which migrants can apply for a naturaliza- tion procedure are also different.
0%
2%
4%
6%
8%
10%
12%
14%
16%
18%
1990 1995 2000 2005 2010 2015 2019
Belgium Germany Italy Spain
Sources: United Nations (2019); HWWI
Figure 4: Share of foreign nationals at city level, 2018 (in %)
2.3 | Demographic and macroeconomic conditions
Migrants encounter different demographic and macroeconomic conditions in the four host countries. The following four tables give an overview.
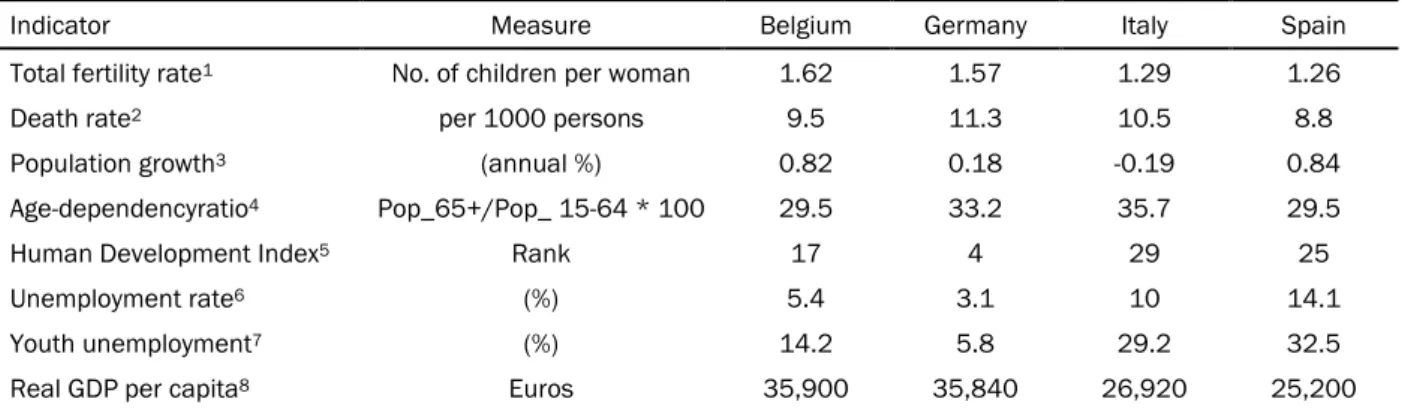
Table 1: Basic demographic and macroeconomic parameters (national level)
Indicator Measure Belgium Germany Italy Spain
Total fertility rate1 No. of children per woman 1.62 1.57 1.29 1.26
Death rate2 per 1000 persons 9.5 11.3 10.5 8.8
Population growth3 (annual %) 0.82 0.18 -0.19 0.84
Age-dependencyratio4 Pop_65+/Pop_ 15-64 * 100 29.5 33.2 35.7 29.5
Human Development Index5 Rank 17 4 29 25
Unemployment rate6 (%) 5.4 3.1 10 14.1
Youth unemployment7 (%) 14.2 5.8 29.2 32.5
Real GDP per capita8 Euros 35,900 35,840 26,920 25,200
Sources:
1 United Nations Development Programme 2019; year: 2018
2 Eurostat [tps00203]; year: 2019
3 Eurostat [tesem140]; year: 2019-2020
4 Eurostat [sdg_08_10]; year: 2019
5 Eurostat [tps00199]; year: 2018
6 Eurostat [tps00029]; year: 2019
7 Eurostat [demo_gind], own calculations; year: 2019
8 Eurostat [tps00198]; year: 2019
0%
5%
10%
15%
20%
25%
30%
Antwerp Hamburg Madrid Bologna
Sources: Local statistical offices; HWWI
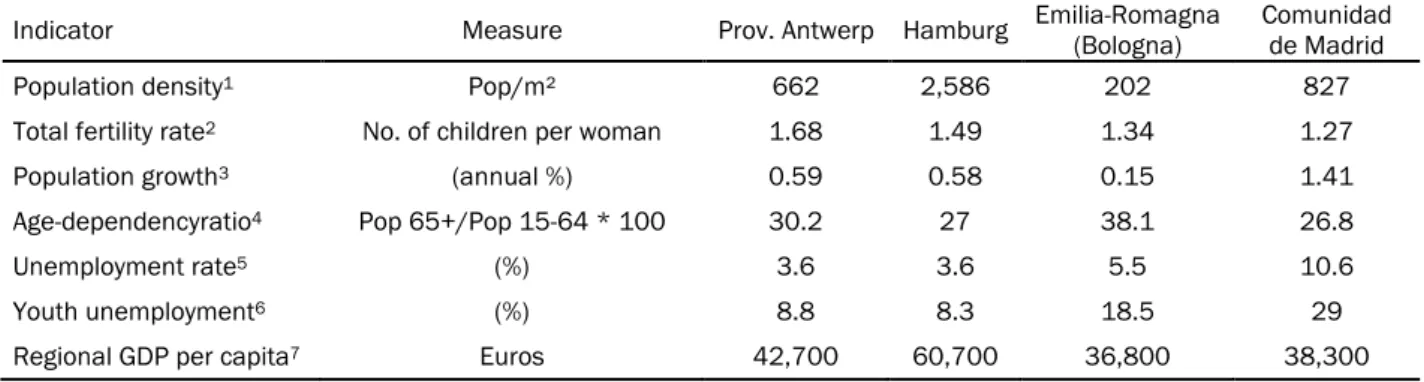
Table 2: Basic demographic and macroeconomic parameters (regional level (NUTS-2)
Indicator Measure Prov. Antwerp Hamburg Emilia-Romagna (Bologna) Comunidad de Madrid
Population density1 Pop/m² 662 2,586 202 827
Total fertility rate2 No. of children per woman 1.68 1.49 1.34 1.27
Population growth3 (annual %) 0.59 0.58 0.15 1.41
Age-dependencyratio4 Pop 65+/Pop 15-64 * 100 30.2 27 38.1 26.8
Unemployment rate5 (%) 3.6 3.6 5.5 10.6
Youth unemployment6 (%) 8.8 8.3 18.5 29
Regional GDP per capita7 Euros 42,700 60,700 36,800 38,300
Sources:
1 Eurostat [tgs00024]; year: 2018
2 Eurostat [tgs00100]; year: 2018
3 Eurostat [tgs00096], own calculations; year: 2018-2019
4 Eurostat [demo_r_pjanind3]; year: 2019
5 Eurostat [tgs00010]]; year: 2019
6 Eurostat yth_empl_110]; year: 2019
7 Eurostat [tgs00005]; year: 2019
On the national level (see Table 1 ), Belgium and Germany on the one hand, and Spain and Italy, on the other hand, show similar conditions. In terms of HDI1 , Germany achieved the highest score in key human development dimensions among the four coun- tries. Germany also shows the highest economic prosperity in terms of GDP per capita and unemployment. However, it exhibits a low birth rate and an ageing society, with 33.2 people aged 65 and older for every 100 people aged between 15 and 64. Belgium’s demographic trend is more favourable than Germany’s. The small country also performs well in terms of GDP; however, unemployment, and especially youth unemployment is higher than in Germany. The economic performance of Italy and Spain is worse com- pared to their Western European counterparts. Unemployment is much higher and in- come per capita is lower. While Spain’s fertility is lower, its age-dependency ratio is much more favourable for Spain compared to Italy.
From a regional perspective, the NUTS-2 level shows a slightly different picture (see Table 2), partly due to basic differences in the socioeconomic structure of the classified regions. The city of Hamburg and the Province of Antwerp display more favourable economic numbers than the Comunidad de Madrid and the Emilia-Romagna region, es- pecially concerning the unemployment rates among young people. Regarding the pop- ulation structure, Hamburg and the Comunidad de Madrid currently display compara- tively low age-dependency ratios, compared to the other two regions, a fact that fits their status as more densely populated (and thus more urbanised) places. While all regions exhibit a population growth between 2018 and 2019, Madrid stands outs with a growth rate of 1.4%. Of course, any subsequent regional comparisons need to be interpreted in this context.
1 The HDI (Human Development Index ; 1=high, 188 =low) is the geometric mean of normalised indices for each of the three following dimensions:
long and healthy life, knowledge, and a decent standard of living. The health dimension is assessed by life expectancy at birth, the education dimen- sion is measured by mean of years of schooling for adults aged 25 and over and expected years of schooling for children of school entering age. The standard of living dimension is measured by gross national income per capita.
There are multiple effects of macroeconomic and demographic conditions on migrants‘
daily lives and integration prospects, but the direction is not clear a priori. For example, it depends on the generosity of migration and integration laws and social policies, whether favourable economic conditions positively affect migrants‘ individual prosper- ity. The forecasted demographic trends should encourage effective measures for migrant recruitment and rapid integration.
Thus, there is a range of individual characteristics and macro level conditions that im- pact migrants’ integration. A range of structural indicators will be discussed below that present different facets of integration success. According to the MICADO project’s four key activity fields, we will refer to integration in the fields of health, education, housing, and employment. To shed light on the performance of different migrant subgroups, we will differentiate by EU vs. non-EU country of origin, as well as by the migrants’ sex. As far as possible, a comparison with the native population will be presented.
3 | Structural indicators of migrant integration
The structural indicators to be presented focus on the MICADO project’s four main fields of action – labour market, education, health and housing. Due to different data availa- bility, most indicators can be presented in the field of labour market integration, fol- lowed by educational integration. With respect to housing and health only a few indica- tors can be reported. If not stated differently, all indicators refer to persons aged 20 to 64.
The reference group provided for each indicator is the group of residents who were na- tive-born. That is, integration is interpreted as a situation where individuals with migra- tion background perform equally as individuals without migration background in the respective aspect. Thus, integration is not an absolute measurement but has been meas- ured in relative terms. According to this view, integrational failure is not suggested to be a personal fault – neither on the side of the migrants themselves nor on the side of the stakeholders in charge of this task – but to be related to differences in individual charac- teristics and macroeconomic and societal circumstances. This definition sees integration as ‘a process as well as a policy goal and a state’ (European Council 1997, p. 174). By doing so, it paves the way for action, as a notable part of individual layers can be influ- enced by tailor-made political, societal and business strategies.2
3.1 | Employment
Among indicators of labour market integration, the employment rate, defined as the pro- portion of the working age population in employment, is considered to be a key social indicator when studying developments within the labour market. High employment rates among migrants imply good access to jobs and thus less dependence on social se- curity systems, therefore also improving opportunities for migrants to participate in so- cial life.
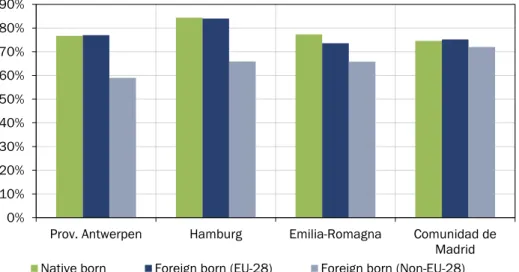
Figure 5 shows that in Belgium and Germany the EU foreign-born population does not differ too much from natives in this respect, while there is a substantial gap between these two groups and the non-EU foreign-born population. In these two countries, a gap of more than 15 percentage points compared to natives can be observed. In Italy and Spain, the situations appear to be different. While in Italy differences between the three groups are negligible, the employment rate for EU foreign-born persons living in Spain is even slightly higher than the rate measured for Spanish natives. The employment rate among non-EU foreign born is five percentage points below the one of natives.
2 The information reported in this chapter adheres to achieved results based on the European Labour Force Survey (EU-LFS) and the EU Statis- tics on Income and Living Conditions (EU-SILC). Definitions refer to Eurostat (cf. Eurostat (2020) in the References section). Nationals (na- tives) are referred to as residents who have the reporting country’s citizenship (whose host country is their country of birth), whereas EU and non-EU citizens (EU and non-EU born) are residents with EU and non-EU citizenship (whose country of birth is an EU and a non-EU country, respectively). ‚Nationality‘ and ‚citizenship‘ are used as synonyms. In what follows, foreign EU-citizens are thus people with nationalities of EU countries that excludes the reporting country, non-EU-citizens are people with nationalities of countries outside the EU.
Figure 5: Employment rates by country of birth, 2019 (in %)
Unemployment is another important feature of labour market (non-)integration.3 Figure 6 depicts the unemployment rates for the native and foreign-born population for the four countries of interest. The unemployment rate is defined as the number of unemployed persons, divided by the sum of employed and unemployed at a certain point in time.
Figure 6: Unemployment rate by country of birth, 2019
3 According to Eurostat and in line with the International Labour Office (ILO) guidelines, an unemployed person is someone who was without work during the reference week, was currently available for work and was either actively seeking work in the last four weeks or had already found a job to start within the following three months. The unemployment period is defined as the duration of a job search, or as the length of time since the last job was held (if shorter than the time spent on a job search).
0%
10%
20%
30%
40%
50%
60%
70%
80%
90%
EU-28 Belgium Germany Italy Spain
Native born Foreign born (EU-28) Foreign born (Non-EU-28)
Sources: Eurostat [lfsa_ergacob]; HWWI.
0%
5%
10%
15%
20%
25%
EU-28 Belgium Germany Italy Spain
Native born Foreign born (EU-28) Foreign born (Non-EU-28)
Sources: Eurostat [lfsa_urgacob]; HWWI.
In all four countries, the unemployment rate for natives was significantly lower than for non-EU foreign-born persons in 2019. Moreover, in all countries except Italy, unemploy- ment was way more prevalent among non-EU than EU foreign-born persons. This gap is particularly surprising in Belgium and Germany, where the rate for the non-EU for- eign-born population almost doubles the rates measured for the other two groups. How- ever, in country comparison, unemployment among non-EU-foreign born is nowhere as high as in Spain, which mirrors the results for the other population groups. Future de- velopment of these numbers will be of high importance for the integration goals. Unem- ployment spells are disadvantageous for individuals’ careers and earnings perspectives and can lead to frustration and resignation, this particularly applies to the younger gen- eration. While among young people in Germany and Belgium, those not born in the EU clearly showed the highest youth unemployment rates compared to native-born and EU foreign born (which is also the case for EU-28), they featured the similar rate as natives in Italy and Spain (see Table 7 in the appendix). In these two countries, unemployment rates of EU foreign-born persons are the lowest in comparions to native and non-EU foreign-born persons, albeit at a far higher level than in Belgium and Germany. Germany stands out with lower rates for all three groups of country of birth.
A particularly severe form of unemployment is long-term unemployment, which refers to the number of people who are out of work and have been actively seeking employ- ment for at least a year. In 2019, the foreign-born population exhibited lower long-term unemployment rates than the native-born in Italy, Spain and in the EU-28 average (see Table 8 in the appendix). However, this pattern does not necessarily imply that circum- stances are more favourable for the nonnative population. It might also be the case that foreign born are under higher pressure of finding a job in order to avoid poverty or to be permitted to stay in the country as findings for Ireland confirm (Krings et al. 2011). In contrast, in Belgium long-term unemployment is most prevalent among non-EU foreign born (59%), while the levels for natives and EU foreign-born persons are almost 20 per- centage points lower. In Germany, the level is lowest for EU foreign-born persons (31%), while it is 10 percentage points higher for natives and the non-EU foreign-born popula- tion.
Beyond the facets of employment performance, the employed also differ in their work- ing conditions across countries. Employment conditions reflect aspects of work quality, for example, in terms of part-time work or temporary work.
A further important feature of employment is self-employment. A self-employed per- son is the sole or joint owner of an unincorporated enterprise (one that has not been incorporated, i.e. formed into a legal corporation) in which they work, unless they are also in paid employment as their main activity (in that case, they are considered to be employees4). In some countries, the self-employed also have unpaid family workers. A
4 https://ec.europa.eu/eurostat/statistics-explained/index.php?title=Glossary:Employee
distinction is also made between self-employed with employees (employers) and those without employees (own-account workers).5
In Belgium and Spain, the share for all groups are slightly higher than in Germany (around 9%), but the differences within the country are also comparably low. The dis- crepancy is the biggest in Italy, where 21.6 % of the native-born population but only 12.0% (14.0%) of EU (non-EU) foreign born are self-employed (see Table 9 in the appen- dix).
In all four countries, nonnatives were less likely to be an employer than an own-account worker (see Table 10 in the appendix). The picture is similar in all four countries. The share of employers is highest among the native born self-employed. In Germany em- ployers represent almost half of the self-employed, in the other countries round 30%.
The second highest share is among foreign-born persons from outside the EU in all coun- tries except Spain. The share among EU foreign born is between 6 percentage points (Spain) and 12 percentage points (Germany) lower than for natives. Germany stands out with the highest shares of employers in all groups in cross-country comparison.
Foreign-born individuals are more often found in temporary jobs than natives in the countries analysed (see Table 11 in the appendix). These gaps are particularly substantial in Spain. In cross-country comparison, Spain exhibits the highest rates of temporary em- ployment, followed - at a notable distance - by Italy. Among foreign-born persons, those with non-EU country of birth mostly feature higher rates than EU migrants.
Another aspect of job quality is the number of weekly hours of work. In the Labour Force Survey, part-time work is recorded when it is self-reported by individuals who, in their own opinion, consider they work for a lower number of hours every week than full time workers. The part-time quota refers to part-time employment as a percentage of total employment (see Table 12 in the appendix).
In Italy and Spain, foreign born (both EU and non-EU) show higher part-time quotas than natives, whereas the pattern is less clear-cut in Belgium and Germany, where the level among the EU foreign-born population is slightly below the level among natives.
From a gender perspective, part-time work is much more frequent among women com- pared to men. Germany stands out with highest part-time employment rate (55%) among non-EU born women, whereas Spain held the lowest rate (39%).
Regional dimension
At the regional level, labour market outcomes also reveal significant differences by coun- try of birth. In Figure 7, employment rates at NUTS-2 level are plotted. Comparing na- tives with the non-EU foreign-born population, employment rates are notably lower among foreign born within all of the regions under investigation. By contrast, comparing
5 A further feature of own-account workers is that they are engaged in production done entirely for their own final use or own capital formation, either individually or collectively.
natives with EU foreign-born persons does not yield a uniform picture. With the excep- tion of Emilia Romagna, employment rates of EU foreign-born individuals are almost the same as for natives. This can be viewed as a sign for a lively intra-EU work migration.
However, it does not necessarily reflect particularly positive job prospects, but also low rates of inactivity. Indeed, a look at the unemployment rate produces a slightly different picture (see Figure 8). While bad perspectives for non-EU foreign-born migrants are con- firmed for all regions, natives are the best performing group in this regard. However, the crucial statement that migrants from outside the EU are faced by greater integration barriers to access the labour market holds for the regional figures as well.
Figure 7: Employment rates at NUTS-2 by country of birth, 2019 (%)
0%
10%
20%
30%
40%
50%
60%
70%
80%
90%
Prov. Antwerpen Hamburg Emilia-Romagna Comunidad de Madrid Native born Foreign born (EU-28) Foreign born (Non-EU-28)
Sources: Eurostat [lfst_r_lfe2emprc]; HWWI.
Figure 8: Unemployment rates at NUTS-2 by country of birth, 2019
3.2 | Education
Labour market prospects vary significantly with educational attainment. Hence, endow- ment with formal education is a key indicator of equal opportunities. Educational levels refer to the ISCED 20116 classification. For individuals in the medium stage of employ- ment life (age 25-64), Figure 9 and Figure 10 depict the educational distribution in each of the four MICADO pilot countries by country of birth.
6 International Standard Classification of Education (ISCED), 2011: High education=levels 5-8 (tertiary education), medium education=levels 3-4 (pper secondary and post-secondary non-tertiary education), low education=levels 0-2 (Less than primary, primary and lower secondary education)
0%
2%
4%
6%
8%
10%
12%
14%
16%
Prov. Antwerpen Hamburg Emilia-Romagna Comunidad de Madrid Native born Foreign born (EU-28) Foreign born (Non-EU-28)
Sources: Eurostat [lfst_r_lfur2gac]; HWWI. Hamburg: no data for EU foreigners; Antwerp: data from 2018
Figure 9: Population aged 25-64 with low education by country of birth, 2019 (%)
Figure 10: Population aged 25-64 with high education by country of birth, 2019 (%)
In all four countries under investigation, tertiary education is clearly less common among non-EU born in comparison to both natives and (except in Belgium) people born in other EU-countries. The largest spreads between natives and non-EU foreign-born migrants are observed for Belgium and Spain. Belgium is also the country with the great- est discrepancy between the two migrant groups, due to the fact that tertiary education is even more widespread among migrants born in other EU-countries than among na- tives. A look at the other end of the educational distribution is also a cause for concern.
0%
10%
20%
30%
40%
50%
60%
EU-28 Belgium Germany Italy Spain
Native born Foreign born (EU-28) Foreign born (Non-EU-28)
Sources: Eurostat [edat_lfs_9912]; HWWI.
0%
5%
10%
15%
20%
25%
30%
35%
40%
45%
50%
EU-28 Belgium Germany Italy Spain
Native born Foreign born (EU-28) Foreign born (Non-EU-28)
Sources: Eurostat [edat_lfs_9912]; HWWI.
The lowest share of low-educated was observed for German native-born (8%), the high- est for foreign-born persons in Italy (54%). In all countries, the share of persons with low education (level 0-2) was highest among non-EU foreign born. The educational gap is particularly extreme in Germany, where the corresponding share of non-EU born is more than four times as high. However, in country comparison, these shares are even higher in the other countries, with Italy standing out.
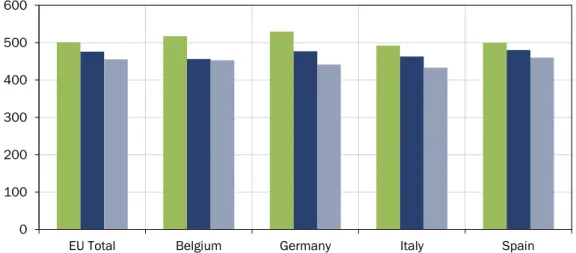
Another measure that reflects the integration of immigrants, in particular those who are younger and currently enrolled in the educational system of the country of residence, are results from standardised tests, such as the OECD PISA test7. Figure 11 shows the mean PISA reading scores for the four countries of interest. This is an important measure of performance, as it evaluates the level of understanding of the country of residence’s language. As presumed, it can be observed that the performance of native pupils with no migrant background is the best in all countries. Native-born pupils with foreign-born parents perform better than foreign-born pupils but the difference is smaller in regard to natives with no migration background. The country with the largest difference be- tween natives and foreign-born pupils is Germany, while the smallest difference is ob- served in Spain, where a relevant part of migrants come from Latin America and the Caribbean with Spanish as their mother tongue.
Figure 11: Mean PISA reading scores by immigration background, 15-year-old students, 2018
Early leavers from education and training denotes the percentage of the population aged 18 to 24 that have attained the lowest level of secondary education, i.e. who have not been involved in further education or training. This indicator hints at disadvantageous educational careers, associated with a potentially harder labour market integration and restricted earnings perspectives among young adults.
7 see PISA website: https://www.oecd.org/pisa/
0 100 200 300 400 500 600
EU Total Belgium Germany Italy Spain
Native born with native-born parents Native born with foreign-born parents Foreign born
Sources: OECD (2020); HWWI; Spain: data from 2015
Figure 12 shows that native-born people are less likely to leave the educational system early, compared to foreign-born migrants, in all four countries. Except in Germany, EU foreign-born persons perfom better than the non-EU foreign-born group. Belgium shows relatively low rates of 13 % (EU born) and 17.8 % (non-EU born), whereas rates for both groups of nonnatives are around 30 % in Spain and Italy.
The indicator clearly emphasises the need to pay attention to early stages of education when it comes to migrants’ educational integration.
Figure 12: Early leavers from education and training by country of birth (age 18-24), 2019 (%)
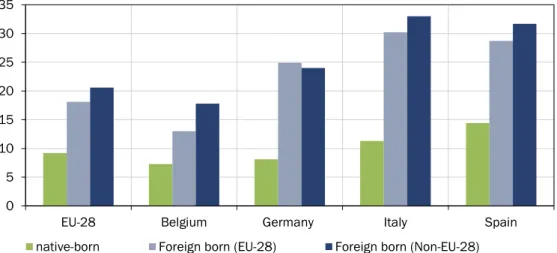
A further indicator that is a valid supplement to the youth unemployment rate is the NEET rate (Young people neither in employment nor in education and training). While the unemployment rate indicates the employment status, the NEET rate comprises teen- agers and young adults who left the educational system and do not work. From the per- spective of the human capital theory, this indicates a waste of resources among the young since they neither invest in general human capital (via further schooling) nor in occupation-specific human capital (via professional schooling or training-on-the-job). As a person’s earnings are closely related to their human capital endowments, the NEET status does not only indicate a waste of talents from a macroeconomic perspective, but also employment obstacles and related poverty risks at the individual level. The NEET rate is an important indicator particularly in the field of migrant integration, since due to deficient language skills or cultural differentiating factors, young migrants can be ex- pected to struggle more often with educational integration than the native born.
0 5 10 15 20 25 30 35
EU-28 Belgium Germany Italy Spain
native-born Foreign born (EU-28) Foreign born (Non-EU-28)
Sources: Eurostat [edat_lfse_02]; HWWI.
Figure 13: Young people (age 15-29) neither in employment nor in education and training, by country of birth, 2019 (%)
Unsurprisingly, Figure 13 shows that the NEET rate among the foreign-born population is clearly higher compared to native born in all four countries. Among nonnatives, EU born show lower rates than non-EU born persons. Across groups, there is an impressive range: While about 6% of people born in Germany form part the NEET group, 33% of the foreign-born migrants from outside the EU between the age 15 and 29 in Italy are neither in training nor education. In Belgium, the discrepancies between natives and and non-EU migrants is most severe.
Language skills are at the interface between education (Section 2.2) and the labour mar- ket (Section 2.1). Deficient skills in the host country’s language is one of the most perti- nent employment obstacles.8 As Table 13 in the appendix demonstrates, they are most significant in Belgium, followed by Italy and Germany, disregarding citizenship. Lan- guage barriers are least important among those who hold a host country citizenship, which might reflect a greater length of stay in the host country or even a completed nat- uralisation.
Regional dimension
In regard to the educational dimension, migrant-specific comparative data is tremen- dously scarce at a regional level. An analysis of educational attainment is at least feasible for the NUTS-2 divide. Figure 14 and Figure 15 illustrate the current situation in the regions of interest. While cross-region comparisons are aggravated by the difference in educational systems, it is again mainly the discrepancy between people born outside the EU and the other two groups that catches the eye. In all four regions, people belonging
8 The information refers to the 2014 Ad-hoc module of the Labour Force Survey which gathered information on this subject.
0 5 10 15 20 25 30 35
EU-28 Belgium Germany Italy Spain
Native born Foreign born (EU-28) Foreign born (Non-EU-28)
Sources: Eurostat [edat_lfse_28]; HWWI.
to the former group are least often observed to have tertiary education (Levels 5-8). How- ever, the extent of this phenomenon differs considerably. In terms of percentage points, it is particularly pronounced in case of Prov. Antwerp and the Comunidad de Madrid.
For Prov. Antwerp and Emilia-Romagna, the comparatively high shares of non-EU for- eign-born migrants with lower upper secondary education (Levels 0-2) are also notable.
All in all, educational barriers are on average thus observable in both migrant groups, with the problem being consistently more pronounced for the non-EU group.
Figure 14: Population (age 25-64) with low education at NUTS-2 by country of birth, 2019 (%)
Figure 15: Population (age 25-64) with high education at NUTS-2 by country of birth, 2019 (%) 0%
10%
20%
30%
40%
50%
60%
Prov. Antwerpen Hamburg Emilia-Romagna Comunidad de Madrid Native born Foreign born (EU-28) Foreign born (Non-EU-28)
Sources: Eurostat [edat_lfs_9917]; HWWI.
0%
10%
20%
30%
40%
50%
60%
Prov. Antwerpen Hamburg Emilia-Romagna Comunidad de Madrid
Native born Foreign born (EU-28) Foreign born (Non-EU-28)
Sources: Eurostat [edat_lfs_9917]; HWWI.
3.3 | Housing and living conditions
Housing in terms of quality and the cost of each person’s living space is an important aspect of the well-being, living standards and social inclusion of individuals (Eurostat 2017). Information on the housing situation of immigrants is still not easily accessible. In EU member states, it seems to be difficult for third-country nationals to rent flats or houses, due to high rents and the occasionally discriminatory attitudes of owners (Euro- pean Council 1997: 47). Figure 16 depicts the owner status of natives and foreign-born persons in each of the four countries, compared with the EU-28-average.
Figure 16: Owner rate by country of birth, 2018 (%)
The share of homeowners is significantly lower among non-EU foreign born than among natives. There is a particular discrepancy to be noted in Belgium, Italy and Spain. In these countries, EU foreign born rank somewhere in the middle, while in Germany own- ership rates are as low as those displayed by non-EU foreign-born migrants. But also among natives, a sizeable heterogeneity can be detected. Whereas in Spain, Italy and Belgium, between 7 and 8 of every 10 natives own their home, only 5 of every 10 people in Germany are homeowners. There are many reasons for the differences observed in the countries, such as a notable variation in housing cultures and building regulations.
As a result, the owner rate gap between the foreign-born population and natives is least pronounced in Germany in the four-country comparison.
The overcrowding rate is defined as the percentage of the population who live in an overcrowded household. A person is considered to live in an overcrowded household if
0%
10%
20%
30%
40%
50%
60%
70%
80%
90%
European Union Belgium Germany Italy Spain
Native born Foreign born (EU-28) Foreign born (Non-EU-28)
Sources: Eurostat [ilc_lvps16]; HWWI.
the household does not have a well-defined minimum of rooms, depending on house- hold composition.9 The overcrowding rate is usually associated with lower income and other indicators of social inclusion.
The foreign-born population was generally more likely to live in an overcrowded house- hold than the native-born population (see Figure 17). In the country comparison, Italy stood out with far higher overcrowding rates which were, for example, among EU for- eign born (40%) more than eight times higher than for their peers in Spain (5%) and roughly almost four times higher than for their peers in Germany (12%) and Belgium (11%). Among the non-EU born population, Italy’s rate of 51% was roughly three times higher than the respective rate in Germany (16%), Spain (18%) and Belgium (20%). The patterns of overcrowding with respect to country of birth and country of residence have already been observed in previous studies (for example, 2015 Eurostat 2017, p. 41).
Figure 17: Overcrowding rate country of birth, 2018
A notable component of living costs is made up of housing expenses. The housing cost overburden rate is defined as the share of the population living in households where the total cost of housing accounts for more than 40% of a household’s disposable income (Eurostat 2017, p. 43). Table 14 in the appendix depicts the evolution of this rate in the four countries and the EU-28 average, differentiating by country of birth.
9 The minimum is defined by: one room for the household; one room per couple in the household; one room for each single person aged 18 and more; one room per pair of single people of the same gender between 12 and 17 years of age; one room for each single person between 12 and 17 years of age and not included in the previous category; one room per pair of children under 12 years of age (Eurostat 2017, p. 42).
0%
10%
20%
30%
40%
50%
60%
European Union Belgium Germany Spain Italy
Native born Foreign born (EU-28) Foreign born (Non-EU-28)
Sources: Eurostat [ilc_lvho16]; HWWI.
Countries notably differ in magnitude and distribution across country of birth. In all countries except Germany, the nonnative population is facing a higher likelihood to be overburdened, with non-EU foreign-born individuals being worse off than EU foreign- born persons. In Belgium, Italy and Spain, the rates are between 6 and 7%. The gap be- tween natives and foreign-born migrants from outside the EU amounts to 27% in Spain, followed by Belgium (17%) and Italy (15%). In Germany, the overburden rate is almost the same for all groups (around 13%).
3.4 | Health
Health is only weakly covered in recent Eurostat statistics, although it is a crucial feature of people’s living conditions and well-being and, thus, also an indicator of integration.
Figure 18 and Figure 19 show the self-perceived level of health. The ratio of persons who consider their health status “very good or good” does not differ tremendously among the groups within the four countries. This finding also holds for the person feeling “very bad or bad” except in Belgium, where the percentage among non-EU foreign born is twice as high as among natives. This pattern hints at certain health disadvantages for this group of migrants in Belgium. However, one needs to be cautious interpreting these results as they represent subjective perceiptions.
Figure 18: Self-perceived health of the population by country of birth: Statement „very good or good“, 2016 (%)
0%
10%
20%
30%
40%
50%
60%
70%
80%
90%
100%
European Union Belgium Germany Italy Spain
Native born Foreign born (EU-28) Foreign born (Non-EU-28)
Sources: Eurostat [hlth_silc_23]; HWWI.
Figure 19: Self-perceived health of the population by country of birth: Statement „very bad or bad“, 2016 (%)
0%
2%
4%
6%
8%
10%
12%
14%
European Union Belgium Germany Italy Spain
Native born Foreign born (EU-28) Foreign born (Non-EU-28)
Sources: Eurostat [hlth_silc_23]; HWWI.
4 | Applicability of integration indicators at the local level
The results presented above focus on the national level. In parts, indicators are also ap- plied at the regional, i.e. NUTS 2 level. Applicability of these indicators to the local, i.e.
city level is problematic for different reasons.
4.1 | Coverage in international macroeconomic databases
Data is drawn from different databases (Eurostat, United Nations, OECD), which cover different territorial levels. Structural indicators regarding the four MICADO domains are mostly taken from the Eurostat database. Education and labour market data are de- rived from the EU Labour Force Survey (EU-LFS10) and data on health and housing is- sues are based on EU Statistics on Income and Living Conditions (EU-SILC11). Both EU- LFS and EU-SILC are conducted by national statistical offices and follow guidelines and definitions which are common for all reporting countries to ensure comparability of re- sults. In EU-SILC, information for the identification of regions is inconsistent between countries (Belgium: NUTS 1, Germany: no information, Italy: NUTS 1, Spain: NUTS 2).
Therefore, comparable results can only be presented at the national level.
For EU-LFS the lowest regional identifier is the NUTS 2 level for all countries. How- ever, given that only the City of Hamburg is a NUTS 2 region, while the other cities only constitute parts of a larger NUTS 2 region (Antwerp: BE21 Province of Antwerp, Madrid:
ES30 Community of Madrid, Bologna: ITH5 Emiglia-Romagna), neither EU-LFS nor EU- SILC facilitate analyses on the local level for all pilot cities.
4.2 | Availability of local indicators at local statistical offices
As Eurostat statistics do not cover sufficient local data for all MICADO pilot cities, comparability of data depends on the availability of certain indicators at local statistical offices. However, as Table 3 shows, only general population indicators by citizenship and/or migration background are offered at the local level. Among the structural indica- tors, only the (un-) employment rate by citizenship and the level of education by country of birth (with the exception of Bologna) could be accessed locally.
10https://ec.europa.eu/eurostat/cache/metadata/en/reg_lmk_esms.htm
11 https://ec.europa.eu/eurostat/cache/metadata/en/lfsi_esms.htm
Table 3: Availability of integration indicators at different territorial levels
National Regional
(NUTS 2) Local
Population indicators
Immigration x x x
Migrant stock x x x
Refugees and asylum seekers as percentage of migrant stock x
Share of foreign nationals x x x
Structural indicators
Employment
Employment rate, by country of birth x x x1
Unemployment rate, by country of birth x x x1
Self-employment rate, by country of birth x x
Temporary employment rate, by country of birth x x
Part-time employment rate, by country of birth x x
Obstacles to getting a suitable job, by country of birth x Education
Population by education and country of birth x x x1
PISA reading score of 15 years old students, by country of birth x Early leavers from education and training, by country of birth x
Young people (aged 15-29) neither in employment nor in education
and training, by country of birth x
Housing
Owner rate, by country of country of birth x
Overcrowding rate, by country of birth x
Housing cost overburden rate, by country of birth x Health
Self-perceived health, by country of birth x
1 Missing data for Bologna
4.3 | Different definitions
A further issue, which even complicates comparisons between cities, is the inconsistent definition of migration background. While in Hamburg and Antwerp the group of per- sons with a migration background includes person who themselves and/or whose par- ent(s) migrated, local data for Madrid and Bologna only distinguishes between natives and foreign-born persons, irrespective of the migration history of the parents. Moreover, subdivision of certain indicators (e.g. by age groups) is not consistent between all cities.
5 | Conclusion
This paper aims to map the current state of migrant integration in Belgium, Italy, Spain and Germany as regards relevant structural indicators. The data on employment, hous- ing and living conditions, education and health show the great diversity of immigrants' positions in the integration process.
The reference group provided for each indicator corresponds to the group of residents who are native-born. In this view, integrational failure is not suggested to be a personal fault but related to differences in individual characteristics and macroeconomic and so- cietal circumstances. Following this notion paves the way for action, as a notable part of individual layers can be influenced by tailor-made political, societal and business strat- egies.
It turns out that there is still a long way to go to achieve migrant integration. Countries perform differently across indicators and population subgroups. Some examples:
- The gap in the housing cost overburden rate between foreign-born persons and natives was recently most pronounced in Spain;
- Italy stands out with the lowest average educational level among the non-EU born population and has the highest NEET rate (NEET=neither in employment nor in education and training) among 15-29 year-olds, irrespective of country of birth;
- Germany displays the highest part-time share among the employed non-EU for- eign-born and foreign-born persons in general;
- Italy reports the highest overcrowding rate among the foreign-born population;
- The revealed country-specific challenges might serve as a starting point for local stakeholders to investigate possible causes, identify potential deviations at local level, and learn from the good practices established in partner countries that per- form better on the respective indicator.
However, as this paper has already emphasised on several occasions, structural indica- tors derived from publicly available secondary data have a couple of shortcomings.
Whereas some data is completely lacking, other data is available but not in the appro- priate format to be able to draw meaningful conclusions. Awareness of data limitations is a key when data are collected and handled at a local level, which is the subsequent step to be carried out within the MICADO project framework. Below is a list of some of the flaws of statistical indicators, although it is not complete. They are supplemented by some recommendations (R) on how to manage them in the MICADO project framework.
• Partially deficient longitudinal scope of data. It is important to trace potential effects of policy reforms and other country-specific context variable changes on migrant integration over time. However, some information lacks sufficient
longitudinal scope for the whole country under consideration. For example, German data on the population regarding level of educational attainment, sex, age and country of birth12 are not available before 2017.
o R: Data collection with a sufficient longitudinal scope will be a com- pelling issue at local level. As complicated and time-consuming data harmonisation standards and processes are dispensable or at least less demanding at the local level, this will hopefully make it easier to access data for wider time spans.
• Partially deficient country and subgroup coverage. Some indicators are avail- able for a wide spectrum of subgroups and countries, but cross-country and cross-subgroup comparisons are not feasible if one relevant group is missing.
o R: The spatial proximity of relevant actors and opportunities to inter- view people at local level, lower complexity of data architecture (com- pared to European level) and the option to fill emerging gaps in sec- ondary data with newly collapsed field data should boost the appropriateness of the local data pool for the purposes of the MICADO project.
• The national level may be misleading, due to considerable regional variation.
More disaggregated data is necessary to avoid false conclusions based solely on the national data.
o R: Collecting data at a local level in pilot cities will circumvent the above-stated problem and ensure a regional fit.
• A lack of subjective evaluations. Structural indicators report integration out- comes defined by statistical bodies. Consequently, they lack information on subjectively assessed integration outcomes, by migrants themselves or third parties (public authorities, etc.), including migrants’ attitudes towards their host country, their personal expectations concerning their situation and their participation in social and political processes. Since integration also involves and concerns the host society, attitudes of the majority (indigenous) popula- tion are also indispensable.
o R: Migrant surveys provide more disaggregated data such as in Ger- many. For example, additional information on migrant attitudes, norms and values, sense of belonging etc. has been gained from a Ham- burg-specific analysis of the ‘Integrationsbarometer’ carried out by the Expert Council of German Foundations on Integration and Migration (Sachverständigenrat Deutscher Stiftungen für Integration und Migra-
12 Code: edat_lfs_9912
tion, SVR Migration) on behalf of the Free and Hanseatic City of Ham- burg - Ministry of Labour, Social, Family Affairs and Integration (SVR- Forschungsbereich 2018).
• A lack of information on process indicators. To assess the meaningfulness of integration policies in EU countries, it is essential to evaluate integration out- comes in the context of the policy instruments chosen. This requires sensible cross-country measures for the scope and focus of such policy efforts, which are also currently lacking. The policy analysis undertaken in MICADO is seek- ing to fill this gap.
o R: The legal and policy framework in the four countries at a national and regional level was analyzed in the MICADO project by means of creating a policy map. At the regional level, this map also contains pub- lic and private initiatives in the field of migrant integration.
• Difficult applicability to the local level. Only a few migration related indica- tors are consistently available, as the local level is a not part of macroeconomic databases such as Eurostat. Therefore, comparability depends on the availabil- ity of indicators and common definitions at local statistical offices.
o R: As the harmonization of indicators between the four pilot cities can hardly be achieved in the MICADO project, there should be local solu- tions rather than a universal solution for the presentation of local data.
6 | References
BMFSFJ – Federal Ministry for Family Affairs, Senior Citizens, Women and Youth (Bun- desministerium für Familie, Senioren, Frauen und Jugend) (2017a): Gelebte Vielfalt:
Familien mit Migrationshintergrund in Deutschland, Berlin, Juni 2017.
European Council (1997): Measurement and Indicators of Integration, Council of Europe Publishing, https://www.coe.int/t/dg3/migration/archives/documentation/Se- ries_Community_Relations/Measurement_indicators_integration_en.pdf, accessed 30.03.2019.
European Council (2010): Declaration of the European Ministerial Conference on Inte- gration (Zaragoza, 15 & 16 April 2010), 16.04.2010, https://ec.europa.eu/migrant-in- tegration/librarydoc/declaration-of-the-european-ministerial-conference-on-inte- gration-zaragoza-15-16-april-2010, accessed 08.04.2019.
Eurostat database: https://ec.europa.eu/eurostat/data/database
Eurostat (2017): Migrant integration. 2017 edition, Eurostat statistical books (Eds.: Piotr Juchno, Mihaela Agafitei), publication office of the European Union, Luxembourg, available under: https://ec.europa.eu/eurostat/documents/3217494/8787947/KS-05- 17-100-EN-N.pdf/f6c45af2-6c4f-4ca0-b547-d25e6ef9c359, accessed 28.03.2019.
Eurostat (2020): Statistics Explained/Migration and migrant population statistics, avail- able under https://ec.europa.eu/eurostat/statistics-explained/pdfscache/1275.pdf, accessed 16 October 2020.
Fuchs, J.; Kubis, A.; Schneider, L. (2016): Replacement migration from a labour market perspective. Germany’s long-term potential labour force and immigration from non-EU member countries, IAB Discussion Paper 04.
Krings, T.; Bobek, A.; Moriarty, E.; Salamonska, J.; Wickham, J. (2011): From boom to bust: Migrant labour and employers in the Irish construction sector, Economic and Industrial Democracy, published online 22 February 2011.
OECD (2020): Reading performance (PISA) (indicator). doi: 10.1787/79913c69-en (Ac- cessed 06 Octoer 2020)
SVR-Forschungsbereich (2018): Integration in Hamburg. Sonderauswertung des SVR- Integrationsbarometers 2018, Berlin.https://www.hamburg.de/content- blob/11957404/6bab964ab4c1d1946f59b2ff5fb3f17e/data/sonderauswertung-in- tegration.pdf, accessed 16 October 2020.
United Nations, Department of Economic and Social Affairs. Population Division (2019):
International Migrant Stock 2019 (United Nations database, POP/DB/MIG/Stock/Rev.2019).
United Nations Development Programme (2019): Human Development Report 2019. Be- yond income, beyond averages, beyond today: Inequalities in human development
in the 21st century. New York. http://hdr.undp.org/en/content/human-develop- ment-report-2019