CENTRE FOR ECONOMIC RESEARCH
WORKING PAPER SERIES
2003
A Multi-Country Study of Inter-Generational Educational Mobility Arnaud Chevalier, University College Dublin
Kevin Denny, University College Dublin
Dorren McMahon, Marino Institute of Education, Dublin
WP03/14 May 2003
DEPARTMENT OF ECONOMICS UNIVERSITY COLLEGE DUBLIN
BELFIELD DUBLIN 4
A multi-country study of inter-generational educational mobility
Arnaud Chevalier
(Institute for the Study of Social Change (ISSC), University College Dublin &
LSE)
Kevin Denny1
(Economics Department and ISSC, University College Dublin & IFS, London)
Dorren McMahon
(Marino Institute of Education, Dublin & ISSC)
Paper presented at the University of Southampton, March 17th 2003
Abstract
This paper analyses intergenerational educational mobility using survey data for twenty countries. We find that a number of interesting patterns emerge.
Estimating a measure of mobility as movement and an index of mobility as equality of opportunity we find that while these two measures are positively correlated, the correlation is far from perfect. Examining the link with educational inequality we find evidence which suggests an inverse relationship between mobility and inequality consistent with egalitarian theory. The relationship between mobility appears to be weak, high returns to education do not depress mobility, as some human capital theories would suggest. Mobility appears to be somewhat higher for men whereas equality is much the same for both sexes. There is evidence that mobility as equality of opportunity has risen consistent with modernization theory. There is no evidence that expansion of third level education has led to a fall in the penalty associated with having a low educated parent. Estimates of marginal mobility are quite different from average mobility.
1 Corresponding author: Kevin Denny, Economics Department, University College Dublin, Belfield, Dublin 4. email: Kevin.denny@ucd.ie tel: +353 1 716 4613. Our thanks to Statistics Canada who provided the data. The opinions expressed in this paper are those of the authors and not Statistics Canada nor the OECD who coordinated the collection of the data. We thank participants at the Social Stratification Conference (RC28) at the University of Tokyo and at Southampton , for comments.
1 Introduction
People who are well educated are likely to have children who are also well educated.
The converse holds for people who have low education. This simple stylised fact holds to varying degrees in all societies for which we have reliable data. It is clearly of importance to parents and their children themselves. It is important to policy makers since it has implications for the workings of a countries’ educational system:
if the relationship between childrens and parents education is, in some sense, too strong this suggest a lack of opportunity for those with a less educated background.
For social scientists, particularly sociologists, it is also important since education is likely to be an important part of the process which gives rise to social stratification.
Economists have recently developed an interest in this topic since theoretical models of educational financing have strong implications for educational mobility
This paper examines the educational mobility between fathers and their children using the International Adult Literacy Survey for 20 countries. We present results for fathers only but in the following literature review some of the issues consequent upon this choice will be considered. These centre largely on the parents and family since it is within the familial context (whatever shape it may be) that the mobility takes place.
Comparison across countries of educational mobility patterns is not easy given the enormous differences between national educational systems. However, in the literature review we try to capture some of the patterns in educational distributions that have occurred. It should be noted that most of the literature which refers to education and mobility also refers to social class/social mobility something we are keen to minimise in the study for the present.We outline some of the relevant research literature below.
Familial Influence: The Theory and the Results
There are a number of channels through which parents can influence the educational outcomes of their children. Studies by Entwistle and Alexander (1992, 1994) use the BSS (before school study) Baltimore study to examine the reading and math comprehension of young children. These studies are used to look at early schooling and educational inequality. They examine the role that parents play in their children’s educational mobility. They believe that attending school may help low socio- economic status youngsters in part because it provides a setting where family stresses are temporarily screened out. The second theory emphasises the different roles that parents of various socio-economic status backgrounds set for themselves with respect to their children’s education. Middle-class parents conceive of themselves as active partners in the education of their children, while working class parents prefer to leave the role of educator to the school (Lareau, 1987).
Entwistle and Alexander noticed that the scores for children differed according to season, which could reflect parental involvement for better-off children. Thus, when school was in session parental effects were redundant but when school was not in session, in summer, it added importantly to student achievement. High socio- economic status parents take over the role of teacher in summer and because of high contact with the school in winter they know the level and kind of experiences that their children are ready for. So, summer decrement in children’s progress illustrates a lack of a “special kind of human capital”. Thus, we may modify our opening
statement: most people who are well educated and well off are likely to have children who are well educated.
A third theory relates to another kind of human capital. In their analysis of BSS data, they find that parent’s expectations are powerful predictors of children’s performance, irrespective of socio-economic status. These results are corroborated by other researchers even reporting parent’s expectations to be more potent than the child’s IQ in predicting school performance (Parsons et al 1982). This is also found by Dearden et al (1997). One could extrapolate here that better educated and/or motivated parents would be more likely to influence their child’s educational attainments.
Entwistle and Alexander (1992) note that low socio-economic status parents are just as likely to hold high expectations for their children as high socio-economic status parents are but the latter were found to be more better informed about the child’s performance level than those of low socio-economic status parents. High socio- economic status parents are good at processing information furnished to them by the school that will help them monitor the child’s schooling. Their expectations are also a useful resource for the child. Earlier research by Entwistle and Hayduk (1982) found that lower socio-economic status children were influenced by their parent’s expectations only in the first semester of the first grade. Thereafter, parents expectations had much less influence on these children, perhaps, because they found their parent’s expectations were not particularly useful as sources of information.
Higher socio-economic status children continued to respond to their parent’s expectations as far as they were followed in the study (to the 3rd grade).
Data used in the above studies can suggest only that home resources found in high socio-economic status families have some role in promoting children’s achievement in the summer months. The human resources that usually accompany material resources may hold the key, such as parental level of education.
Work by Schneider and Coleman (1993) reflects the increasing emphasis placed by Coleman on the role of the family in the development of the young person’s cognitive skills. Their report focuses on the nature and consequences of parental involvement, family home, school and community. Parental involvement was assessed along with family composition and maternal employment on cognitive outcomes. The characteristics of schools that foster or impede parental involvement in school were considered. Finally, the factors that determine parental choice of schools were analysed2. Schneider and Coleman found that structural deficiencies in families i.e.
non-intactness could be overcome by functional strengths as reflected in parental involvement with the child. Modifying our opening statement, people who are well educated and who promote educational attainment are likely to have better educated children.
The studies referred to above discuss how the characteristics of a father and mother might influence the value that each places on a child’s educational level and thus affect the levels of educational mobility. That influence might be gender specific. A mother’s socio-economic background, for instance, might affect not only her values
2 For evidence of this choice see for example Machin and Gibbons(2002) who assess the value attached by parents to school quality by looking at house prices.
but also those of her husband. Alternatively, the background of the father, for example, could influence the values of the mother as well. In social mobility studies, conditions of work such as degree of autonomy or the complexity of a job are traditionally considered as part of the father’s occupation, which leaves the impact of the mother’s social position unaccounted for (Kohn, 1989). If all mothers were in paid work, the labour conditions for both parents could be considered but this would mean restricting the study to a dual-earner couple. By way of contrast, using levels of education rather than occupation simplifies the study to one of straightforward educational mobility. The present study concentrates on the level of education as the background variable for fathers only. There are problems with this choice such as the effect of mother’s education on their children. Mare (1996) showed that mother’s educational level did influence that of their daughters. Indeed Behrman(1997) shows that this the strongest relationship.
The attention that should be given to both father’s and mother’s level of education is also prompted by dissatisfaction with measures that are often presented as “family”
measures but are restricted to father’s occupation or income. Acker (1973) recognises this restriction as paternalistic but it has also led to a conceptual gap on the importance of the wife/mother in the family situation and any potential they may have in the mobility process. This gap begs the question how does the nature of a father’s education influence the role of his wife. For the purposes of the present study we are looking at educational mobility in the traditional way, that is, according to father’s/husband’s level. Any further study should think about following in the footsteps of Van der Slik, De Graaf and Gerris (2002) and consider the parent’s characteristics and how they influence the educational level of a child.
Cross-National Studies
While the present study covers a large number of countries, such an exercise is not without its problems. Shavit and Blossfeld (1993) and Müller (1991) point out how difficult it is to look at the distribution of qualifications compared across countries let alone look at the issue of cross-national educational mobility. The countries that we are analysing differ considerably in the historical development of their educational systems and in the educational options available to the members of the cohorts studied when they were of school age. The outcomes of schooling can be seen according to the qualification levels distinguished in scales such as the CASMIN scale.
Müller shows that the differences in educational distributions are quite marked among the nine CASMIN nations. Only two aspects were common to the countries studied.
Firstly, more people gain only an elementary qualification than any other. Secondly, all countries have a similar proportion of graduates with the highest level of qualifications. The proportion of university level graduates varies in a narrow range between above four and below seven percent.
Müller’s distributions show that two blocks of countries can be identified. First, there are the countries of Britain and Ireland. In terms of the distribution pattern, Sweden is quite close to Britain/Ireland even though historically Sweden would be regarded as being closer to the German tradition with respect to higher education. The second block of countries close to one another is represented by Poland and Hungary. In the period before the communist transformation, German and German-Austrian
influences on the education system in both countries have to be acknowledged. The similarities between Hungary and Poland in that period result mainly from their economic retardation. More than half of all employment was in agriculture. In rural areas educational opportunities were sparse. This accounts for the large proportion of people who had not completed compulsory schooling.
Hout (1989) noted that in rural areas education may have a limited value, especially where children expect to follow in their father’s footsteps as farmers. As Gambetta (1987) noted, working on the family farm or in the family business would have been viewed as a more rational investment than education. Many of the rural areas in our data set will have faced difficulties in organising education. Overall, it can be expected that there is a relatively high chance of those from farm origins having low level qualifications. However, the disadvantage of the farm sector may be greatly reduced if it contains a relatively high proportion of wealthy farmers. It is also possible that policy efforts have been made to incorporate rural areas into an education system that offers at least a second level education (Jonsson 1993; Breen and Whelan 1996).
The similarity in development between Hungary and Poland after the second world war results from their common policy of communism and their adaptation to the Soviet philosophies of education. There was one main difference between Poland and Hungary and it is that Poland did not develop educational courses leading to intermediate certificates. Thus, the proportion of Polish cohorts assigned to the intermediate qualification is very small.
Outside of the British/Irish block and Polish/Hungarian block, France and Germany are very distinct and can be said to represent the extremes in the sample of nations.
For France, if we look at the aggregates for the three qualification levels, elementary, secondary and tertiary we find the most skewed distribution of all nations as a result of the very strong selectively institutionalised French school system. Germany, on the other hand, has the most even distribution. Germany is unique in many ways due to it’s emphasis on vocational training. In the German case only a small minority leave school with the minimum of compulsory schooling.
The picture of varying qualification structures found in the CASMIN data at the beginning of the 1970s gets more complex if one takes into account the fact that these cross-sectional distributions are aggregates of cohorts with very different educational opportunities at the historical times that they were of school age. This is a problem with the IALS data which we have tried to overcome with the use of cohort analysis.
In the CASMIN data the proportions of those who received only elementary education strongly declined whereas the proportions of intermediate and higher education increased. In France, this process started from a higher level of elementary education and it did not proceed as far as other nations. The smallest amount of change took place in Germany.
Overall, on the basis of Müller’s work on the CASMIN data set one can say that there were considerable differences in the educational opportunities and educational outcomes between the nations studied. They result from different education traditions and different institutions of educational provision that affect the decisions of parents and children for the latter’s education.
Educational Mobility
One of the few studies to focus on educational mobility is a study by Checchi et al (1996) comparing the US with Italy. They argue that the more centralised state school system in Italy should be expected to reduce income inequality and make intergenerational mobility easier. The authors were surprised to discover that the US, which they regarded as having a bigger private education system, displays higher intergenerational upward mobility between occupations and more importantly between education levels. They offer a human capital explanation building around the idea that even though it may be easier in Italy to move up the social ladder the incentive to move may be lower making mobility less likely.
In the US system the fact that family background is less important than in the Italian system in which education is centralised and public is a question that they explicitly address in their paper. The prevalence of non-competitive labour markets and barriers to entry/exit into/from occupations can explain only part of their observed evidence.
The authors propose an explanation that highlights a “distortion of the incentives to human capital investment and to upward mobility that a centralised public education system generates” (Checchi et al: 21). The individual incentive to accrue human capital is reduced for two reasons when the same quality of education, supported by income taxes, is offered to everyone. Firstly, tax on income reduces the direct benefit to the person who decides how much work to put into the schooling activity.
Secondly, it is impossible to equal greater talent and individual effort with a better education. A father who expects their child to be talented can provide them with a better education out of their own income whilst in the state school system his financial contribution is to a common fund and therefore has no specific effect on the child.
Thus, when the quality of education is relatively more important for the accrual of human capital, the state system should display more mobility because across the income groups the incentives to go to school rather than not go are similar. Checci et al cannot prove from their data set that this is the reason for the low level of social mobility in Italy in comparison to the US. However, their analysis of educational mobility seems to offer a more plausible explanation. The opportunities of reaching the higher educational category are more unequally distributed in Italy than the US.
The odds of reaching a high school degree or more are larger if the father is in the same educational category (the odds ratio is 27.3). They show that only the Bartholomew index of movement indicates more mobility for Italy. However, this is an indicator of movement and not of equality of opportunities. This index has been driven by the structural change towards higher education that was typical of Italy in the post-war period. However, it masks the existence of unequal opportunities.
In order for a state school system to generate more mobility than a private system (as they describe the US) it has to be relatively more efficient in selecting talent and reward individual effort. This explanation relies on another part of their theoretical framework and that is the role of self-confidence in determining the likelihood of an investment in human capital. When making an important decision about schooling a person has besides the income and education already received by the family, a problematic situation: just how good are they that is how do they rate their own abilities?
This self-confidence is a critical factor in each person’s decision about schooling.
This belief summarises information about each person’s own talent. Thus, this belief becomes an important way in which family background affects the decision of a child.
Their model suggests that the assessment of the performance of a centralised education system (as in Italy) should take into account the relative importance of individual effort and of the quality of education in the accruing of human capital.
They argue that at the elementary level of education individual effort is less important. In the case of higher education, particularly at university level, individual effort is likely to be more important making a decentralised system like the US more preferable. It would create the right incentives to upward mobility.
Theoretical Issues
Leaving aside the theory which emerges from the above literature review for a moment, we have noted that there are gender and national differences when analysing educational attainments. Even a straightforward study of educational mobility according to father’s and mother’s level of educational attainments is problematic.
The socio-economic background of mothers differ as well as their conditions of work and income. These interact with the father’s characteristics and the complicated analysis that ensues is how to separate out the factors of relevance3.
Analysis of educational attainments by country show that there are both similarities and differences. Across national boundaries the majority of those surveyed had elementary qualifications. Similar levels of respondents had a graduate level of education. In terms of similarities between the systems different blocks have been identified with France and Germany at the extremes in terms of how their educational systems work. Importantly for this paper, Müller points out the importance of cohort analysis, a point which has been taken on board for this paper. Institutional changes in educational systems have taken place at different periods in history.
A theory common to much of the literature review outlined above is human capital theory. Entwistle and Alexander note the parents, in some cases, subsume the role of the teacher in the summer months and also note the role played by parental expectations. Schneider and Coleman stress the involvement of parents as part of the human capital story. Even where families are non-intact, this problem can be overcome by parental involvement. Checchi et al(1999) contribution to the human capital debate is the role of self-confidence. They note that at an elementary level individual effort is less important. However, it is more important at university level making a “privatised” system like the U.S. rather than Italy more preferable. It creates the right incentives to upward mobility. Overall, the more self-confidence that an individual has the more likely they are to invest in human capital.
In social mobility terms we are looking at two movements: the effect of father’s education on his occupational attainments; the effect of child’s education on his/her occupation and the effect of father’s occupation on the child’s occupation. However, as we look at the effect on qualifications of occupation or income we are bringing in
3 Behrman & Rosenzweig(2002) attempt to separate nature/nurture effects and assortative mating effects by comparing the educational achievements of children of twins.
elements of the labour market. If we focus on a particular link, in this instance, between father’s education and child’s education, then our results are less likely to be contaminated by other issues, such as the labour market. Thus, we are not looking at a particular transition but summarising the whole matrix of educational mobility. We are looking at the five levels of education by the four possible transitions. As our data is cross-sectional we will be analysing it by cohorts. So, we would expect to find educational mobility improving over the cohorts. This follows on from the modernisation theory. It is assumed that with modernisation and the expansion of the educational system, that educational selection becomes more meritocratic. However, following on from Müller (1991) Checci et al (2000) above we may find that the education mobility for our father’s and their children may rise or fall depending on the country that we are analysing.
2 Data
The International Adult Literacy Survey (IALS) was administered by twenty one governments between 1994 and 1998 to measure the literacy level of the adult population by using a common data collection structure across countries (see OECD (1995,1997,2000).
The data for Belgium refers to Flanders only. For Switzerland, the data refers to French and German speaking areas though data on the Italian speaking minority was available. The average size of the sample per country is around 2000. The data for Australia is not available to researchers outside of Australia unfortunately. France withdrew from the study in 1995 citing concerns over comparability.
For the respondent’s to the survey we know their years of education. We also know their education classified by levels using the ISCED scheme developed by the OECD.
We know the fathers and mothers education level using the same scheme. To maintain consistency we recode the education levels variables to be:
Level 1: Primary education or less.
Level 2: Completed secondary education, junior cycle only Level 3: Completed second level at senior level
Level 4: Third level, non degree Level 5: Third level, with degree
We define levels 4 and 5 as tertiary education.
3 Measures of Mobility and Equality
Since the paper makes use of a number of scalar measures of both mobility and inequality, it is necessary to describe them in some detail. As measures of inequality we use one purely statistical and one that comes from the extensive literature on income inequality.
Coefficient of variation (Cov): This is the standard deviation divided by the mean. By dividing by the mean we control for the fact that the population of some countries may have higher levels of education than others, on average.
Gini Coefficient (Gini) : This is easiest seen with a diagram. Imagine we order the population from the individual with the lowest education to the highest. We then, starting from the least educated, calculate the cumulative share of successive fractions of the population. For example say there are four individuals in the populations with education in years 10 , 12 , 13 and 15 years of education. The least educated individual has 10/50 = 20% of the total years of education. The two least educated have 22/50 = 44% of the total and the three least educated have 70% of the total. The graph of these cumulative shares against the corresponding number of individuals, expressed as a proportion of the population gives the Lorenz Curve. The highest point on the curve corresponds to 100% of the population having 100% of the education. If everyone had the same education then 1% of the population would have 1% of the education, 5% would have 5% and so on. In this case the Lorenz Curve would be a straight line at an angle of 45%. Inequality then causes the Lorenz Curve to bow down towards the X axis. The Gini coefficient is the ratio of the area above the curve (and below the 45 degree line) to the entire area under the 45 degree line. In the diagram below this is A/(A+B). This will be zero with perfect equality and 1 with perfect inequality (where one individual has all the education in a country). If the Lorenz Curve for a population X lies everywhere above that of another Y then it has a lower level of inequality , a lower Gini coefficient and X is said to “Lorenz dominate” Y.
Figure 1 : The Lorenz Curve
100%
Cumulative share of A Education, income etc B
0%
0% 100%
Population ranked from poorest to richest
The two measures of equality will typically be related. For example, if the variable of interest, say years of education, is log normally distributed then the following can be shown4:
4 See , for example, Cowell(1995)
[ ]
1 2 2
1 ) , (
~ ln
12 2
2
−
=
−
=
σ σ µ
σ
N Gini
e Cov
N y
(1)
So we expect the two indices to be positively related but certainly not linearly.
Eigen value Index5 (Ml): This index is a way of summarizing the degree of mobility implicit in a transition matrix. The observed transition matrix gives the probability of ending in one state given that one starts in some state, in other words these are outflow probabilities. Imagine a matrix which represents perfect equality of opportunities in that the probability of ending up in any state is independent of ones origin. This is the invariant matrix. By comparing the “distance” between the observed and the invariant matrix indicate how rapidly one attains the invariant matrix. In such a case one’s origins are quickly “forgotten” in that their influence erodes relatively speedily. The Eigen value index, Ml is defined as
1− λ2
≡
Ml (2)
where λ 2 is the second largest eigen value, the largest eigen value of any transition matrix is one. If λ 2 is equal to zero then the transition matrix equals to the limiting invariant matrix and corresponds to equality of opportunity. It follows then that ML will attain a maximum of one in a situation of equal opportunities where each generation’s educational outcomes are independent of the previous generations. It has a minimum at the other extreme where ones educational attainment is entirely determined by the previous generations.
Bartholomew Index (Bart): This is based on measuring the average number of boundaries crossed (whether class, education or whatever) . It is given by:
∑∑
−≡
i j
iji j f
B (3)
f ij is the joint frequency in the i,jth cell of the transition index and the modulus of (i-j) is the number of changes in education level made from one generation to the next. In essence it is summarizing how far the population is from the principal diagonal of the matrix. The index attains a minimum of zero when all of the diagonal elements are zero and everyone has the same education level as the their parents.
While intuitively one expects these indices to be correlated there is no compelling reason why they should display the same pattern as they reflect different underlying concepts. Considering the following two transition matrices of absolute frequencies for a hypothetical population of 63 father’s/offspring pairs with three levels of education:
5 This section draws on Checchi et al (1996).
Child’s education
A1 A2
Father’s education
0 0 18
3 0 6
36 0 0 18
0 0
0 9 0
0 0 36
3 2 1
3 2 1 3 2 1
The row totals are the same since there are 36 parents with education level 1, 9 with education 2 and so on. In matrix A1 every child ends up the same education level as their father and hence the matrix is diagonal. Since the Bartholomew Index picks up the extent to which individuals are away from the principal diagonal , it will attain its minimum value of zero in this case. In case A2 there is clearly more mobility, everyone in the second generation attains an education as far away as possible from that of their parents so the Bartholomew Index will be maximized given the marginal distribution of the father’s education. This index is bounded from below by zero but does not have a natural upper-bound (e.g. 1) though it would be easy to normalise it to do so.
Now consider the matrix B: the probability that a child ends up with education level 3 is 22% irrespective of one’s father’s origins (i.e 8/36, 2/9, 4/18). The same is true of the two other rows so there is equality of opportunity and Ml achieves its maximum of one. This happens because the matrix is singular, that is the rows and columns of the matrix are linearly dependent6. Clearly however, by the Bartholomew Index, mobility is not maximized: some of the second generation end up with the same education as their parents. So the choice of index depends on what one’s theory tells us, if anything, about the form of mobility to be expected.
Child’s education B
Father’s education
4 8 6
2 4 3
8 16 12
3 2 1
3 2 1
6 This leads to another index , not presented here, based on the determinant of the transition matrix.
Similarly there is another index based on the trace that picks the extent to which the matrix is concentrated around the principal diagonal.
4 Results
In this section we present and discuss our first set of results. We are interested in the following questions:
i. What is the relationship between educational inequality and educational mobility?
ii. Does the above question tell us anything labour market incentives?
iii. Is educational mobility higher for males or females?
iv. Has educational mobility increased over time?
i The Relationship between educational mobility and inequality.
Intergenerational mobility and educational equality are two key characteristics by which one might judge an educational system. Equality in this context means equality of outcomes rather than of opportunity. Specifically, perfect equality would mean here if everyone had completed the same years of full time education. Note there is no presumption here that equality of outcomes is necessarily is desirable. For example if everyone had no education then inequality would be zero but this is hardly something that one would aspire to.
This is not the only way of assessing the scale of inequality. If educational credentials or levels of education are seen to be the key characteristic then one could look at the proportion who get to third level as an indicator of ex post equality. However this may be more appropriate in some countries than in others so it seems sensible for the purposes of cross country comparisons to use a consistent indicator that doesn’t depend on institutional or other country specific details7. It is also consistent with the enormous economic literature on the returns to education in which human capital is well proxied by years of schooling. If we are ultimately interested in education because through occupational attainment it affects earnings then the econometric evidence is that years of schooling is the appropriate variable to use8.
Measuring mobility raises similar issues with measuring equality: we only observe it ex post. Even if there are no barriers to mobility so that potential or ex ante mobility is high it does not follow that we will observe it if the factors which drive it – heterogeneity of some form within the population – is absent. Nor can we assume that mobility is desirable per se, as mobility can be downward as well as upward.
7 In section 5 when we estimate the marginal effect of parents’ education on educational attainment we employ such a strategy partly for reasons of parsimony.
8 See Krueger and Lindahl(1999) but see also Denny and Harmon(2001) for different results.
Moreover if a country randomly allocated individuals’ education levels then this would generate high mobility but would not be efficient or equitable.
To see what the relationship might be between mobility and equality, we need to think of how family background might influence one’s educational outcomes. There are several mechanisms that can propagate persistence over time of education. The first is that both the genes and the environment of children are likely to be similar to that of their parents. Environment here is meant broadly to refer to religious, cultural, geographical characteristics amongst others. The second mechanism is economic, in a system where education is more privately oriented i.e. supplied by private institutions which charge fees then well educated parents have an obvious advantage in securing a better education for their children. The distinction between a “public” and a “private”
system is extreme. Many countries will have some publicly provided education, particularly at a lower level which may give way to more private provision at higher levels or there may be a mixture of public and private institutions such as tertiary education in the USA.
There are other possible mechanisms, for example educated parents may put a higher value on education or be in a better position to assist their children with schoolwork.
Alternatively if access to better schools is determined by social networks , “the old school tie”, then parents again will tend to pass on advantage to their children. Some of these are discussed in section 1.
Consider an educational system where the state is the dominant influence in terms of financing, curriculum design, assessment and so on. Assume the state acts as “a benign dictator” to impose homogeneity across the system such that the quality of education is comparable for everyone. In such a world the children of low income parents are not trapped by their background so we would expect relatively low inequality of education: the state has removed the obvious barriers. Intuitively one would also expect it translate into higher educational mobility for the same reason.
Indeed for many, educational equality (i.e. low inequality) and mobility might seem to be synonymous. We refer to this view as the egalitarian theory.
The recent paper by Checchi et al (2000) compares the case of Italy and the United States. Italy has a highly centralised educational system. As expected it displays less educational inequality but surprisingly displays less mobility than the US. Parents education is relatively more important for the success of their childrens education.
Their explanation for this paradox is complicated but hinges on the labour market consequences of such an egalitarian education system. If the education system is such as to compress the distribution of education and income then one expects a lower rate of return to education. This is strongly brought out by research on the marginal returns to schooling which shows that countries with more compressed earnings distributions, notably Scandinavian countries, have low rates of return9. If however there are low returns to education then one expects this by itself to reduce mobility.
For children of poorer families the low return to education means that is not worth making the investment time to acquire further human capital. There is, therefore, a sting in the tail of egalitarianism. We refer to this approach as the incentive trap
9 See Harmon et al(2000) for a recent survey.
theory. They suggest that while a homogenous, centralised system may be appropriate at primary level where individual effort and talent is less important, but that universities may be the appropriate point where poorer individuals will benefit from a less homogenous, egalitarian system.
This argument if true has major implications for educational and social policy. While an in-depth analysis of two countries is useful one clearly cannot make a judgement of a general nature from two countries.
Using data from a large number of countries we compare educational mobility and equality. Table 1 below shows the correlation matrix for the four measures of interest.
The results conform with the egalitarian theory using any of the four possible comparisons inequality is negatively associated with mobility. Correlations only examine linear relationships so we need to examine the relationship in more detail. In Table 2 we test for rank correlations across countries. Of the four possible comparisons, two of the rankings are statistically significant (and negative) at the 5%
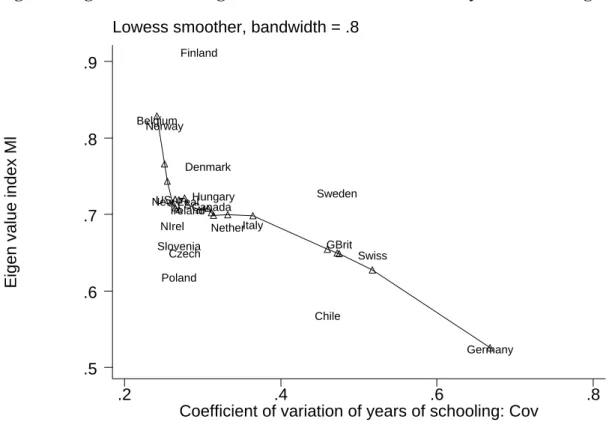
level. To see whether the relationship is being distorted by a small number of outliers we graph the relationship between various pairs. Figure 2 plots the Eigen value index against the coefficient of variation of schooling. We superimpose a non-parametric smooth regression over the data which makes clear the negative curvature. Figure 3 plots the alternative indices against each other. Aside from Chile, there is a clear negative relationship. Plotting the other two permutations tells a consistent story (closer to Figure 2): countries with egalitarian educational systems in terms of the outcome of schooling completed also enjoy greater educational mobility. Our results are not consistent in general with the incentive trap theory. Interestingly if we just compare Italy and the United States, the two countries studied in Checchi et al(1999), we find that they conform to the general pattern found here, an inverse relationship between mobility and inequality. Whether this is simply because of the use of different datasets or slightly different definitions is unclear to us at this point.
ii The role of labour market incentives
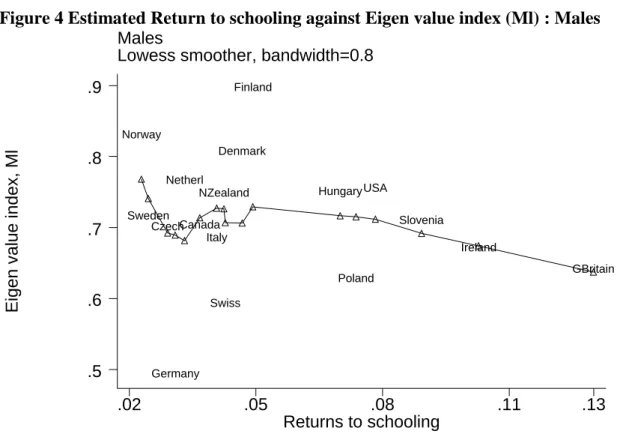
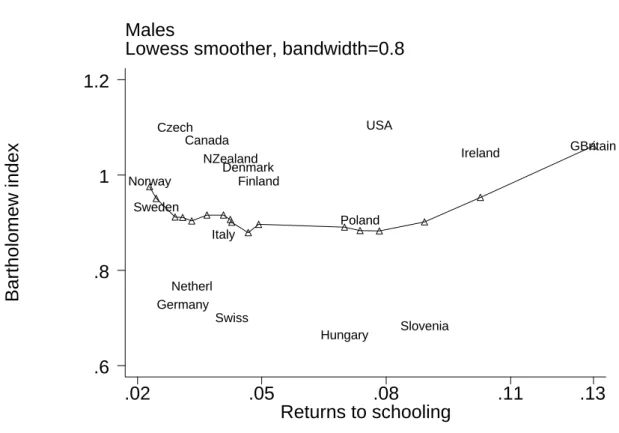
To see why this negative relationship exists one needs to consider whether the incentive effects that this theory relies on are actually that strong. To do this in an informal way we graph estimates of the marginal return to schooling for a subset of the countries of our data10. Figures 4 and 5 plot the return to schooling against the Eigen value index of mobility. The former is the estimated effect of an additional years schooling on hourly wages. Since returns to schooling typically differ significantly between males and females we plot the relationships separately. In general the relationship is fairly flat. However for males there is some tendency to a negative relationship contrary to the incentive trap theory. Figures 6 and 7 plot the schooling return against the Bartholomew index which tells a similar story though there is weak evidence of a positive relationship. For example the Scandinavian countries are well known to have low returns to education largely as a result of a high degree of compression of the income distribution. Yet this has not significantly depressed educational mobility compared to high return economies in less social democratic societies such as Britain , Ireland or the United States.
10 These are estimated from the ISSP data using the standard Mincer equation. Details in Denny et al(2001).
These graphs also bring out an interesting feature of the results that the more corporatist social democratic Nordic countries don’t display very different levels of mobility from the “Anglo Saxon” economies of the US, Britain and Ireland. However they have may arrived at this level of mobility by very different routes.
iii Are there differences between males and females?
Since men and women’s experiences of both the educational system and of education is often quite different it is instructive to consider them separately. In looking at the role of schooling returns we saw above that distinguishing between sexes made little difference. Here we ask two questions , (i) are the levels of our indices different for men and women and (ii) is the relationship between educational mobility and inequality different?
Table 3 shows descriptive statistics for males and females separately. Educational mobility, particularly by the eigen value index, is marginally higher for males while educational inequality is essentially the same. So men have been less tied down by their social background in making educational transitions. Moreover a lower level of educational inequality, as the egalitarian theory might suggest this, cannot explain this11. If mobility is determined by the parameters of a country’s educational system then it somewhat surprising that it should differ between sexes since in general the same rules apply to men and women. It may be the case of course that there areinformal procedures or traditions which convey extra mobility on males. Note that here we are considering mobility relative to father’s education. A different picture might emerge if we contrasted it with mother’s education, this is beyond the scope of the present paper. However if one expected fathers to discriminate in favour of their sons it is not clear what this would imply about mobility. For low education fathers a preference towards their sons would suggest more upward mobility for their sons and hence higher male mobility other things being equal. On the other hand, if fathers’
preference towards their sons is expressed as a desire to minimize risk then they will wish to replicate the status quo for their sons while letting their daughters fend for them. Hence one would expect higher mobility for daughters. Further research is clearly necessary on this issue.
The second question that we address here is whether the inequality/mobility pattern by sex. In Table 4 below we give tests for rank correlations between the four possible pairs for males and females. It shows that in general the negative relationship between mobility and inequality is found for males but not for females. This would suggest males are largely driving the negative relationship observed in Figures 1 and 2 and Tables 1 and 2.
iv Has the relationship changed over time ?
In analyses of occupational or social mobility theory the modernization hypothesis asserts that social mobility increases over time. Since educational mobility must play an important role in this, it is natural to see how these indices have changed. Our data is not ideal for this purpose since we have only a single cross-section for each country. Nonetheless the ages of the respondents vary in age from 16 to 65 (and older
11 Of course one would really like to know educational inequality amongst the fathers rather than their children but the results here are suggestive nonetheless.
for a small number of countries) so we split the sample into those under 45 years and those older and recalculate the indices for these groups12. Figure 8 graphs the change in the indices for each country. Consistent with the modernization hypothesis, mobility increases in almost every country. However the Bartholomew index which measures movement across education classes tells a very different story as shown in Figure 8. A significant number of countries display decreases between cohorts. Table 5 provides descriptive statistics for the two cohorts.
Given that the two indices are reflecting different notions of mobility it shouldn’t be that surprising that they give different results. From Table 6 one can see that the changes in the indices between cohorts are positively correlated, .4252 .
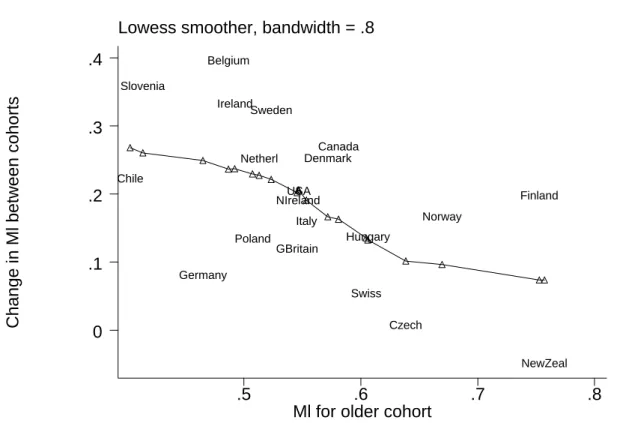
One pattern that is consistent emerges when we graph the change in the index against its initial level (that is for the older cohort), increased mobility is strongly associated with a lower initial level as we see in Figure 10 for the case of the Eigen value index13. This inverse relationship between changes and initial levels is a very common finding in the analysis of time series for example in the substantial literature on cross country growth where it is commonly denoted “beta convergence” in economic growth literature. It is an example of “regression to the mean”, for a variable which is stationary around the mean if one is above average in period one is more likely to move down in the next period and vice versa. What it does not mean is that there is a tendency towards convergence of mobility patterns across countries. Such a conclusions would be a case of Galton’s fallacy which despite its provenance recurs from time to time, see Friedman(1996). Quah(1999) shows that this negative relationship is consistent with either convergence or divergence over time. To determine whether the distribution of mobility is becoming more compressed it is more appropriate to look directly at the evolution of the densities: one should look at the change in the standard deviation: “sigma convergence” as it is known in the economic growth literature14. As can be seem from Table 5 , the evidence is that standard deviation falls for the eigen value index and is more or less constant for the Bartholomew Index.
This is easier to see if one looks at the estimated densities of the two indices for both cohorts in Figures 11 and 12. One can see that for the Eigen value index the distribution has clearly shifted to the right and displays lower kurtosis (it is less
“peaked”). Curiously it has switched from being left skewed to being right skewed.
However with a relatively small one cannot infer too much about the tails of the distribution. The Bartholomew Index changes relatively little however other than a small shift to the right.
5 Multivariate analysis of the probability of attaining higher education
In this section we explore in more details the relationship between the educational levels of both generations. Compared with the macro level correlations that the previous sections have revealed, this allows to control for idiosyncratic
12 Clearly the age ranges of the fathers in the two cohorts are likely to overlap.
13 For the Bartholomew index (not shown here) the relationship is less steep but clearly negative.
14 Barro & Sala Y Martin(199?) introduced this terminology
characteristics. So while the previous section focused on summary measures of mobility – and hence an average- here we estimate the marginal effects of interest.
For each country we select individuals ages 25-65 (in order to limit selection effects due to some younger individuals not having completed their education). One of the advantages of the IALS data is that for all countries the survey was conducted following essentially identical procedures to ensure comparability of scores so each sample should be nationally representative. Rather than study the complete educational decision taken by those individuals we limit ourselves to estimating the determinants of attending higher education.
All countries in the studies have a compulsory minimum school leaving age, which is currently set at secondary level. Also, since secondary education is generally provided free or at low cost to the parents, the intergenerational relationship of interest is the impact of parental education on the probability of attaining some tertiary education.
Furthermore, a recent trend in education policies has been to increase access to tertiary education. Thus it can be argued that this is the educational decision of interest. An alternative approach due to Mare(1980) looks at the sequence of staying on decisions by individuals at they continue through the educational system. Given the multi-country nature of this study this would have suggested an excessive number of parameters.
A simple reduced form of the decision to enrol at university has the following form:
ε β
β
β + + +
= S S X
Uni d d m m X (4)
where Uni is a dichotomous variable taking a value of unity for individuals reporting an education above level 4. Sg are vectors of the parental education, with g taking value d for the father and m for the mother. X is a set of individual characteristics and ε represents an error term due to non-observable characteristics affecting the decision to attend college.
As discussed earlier, parental education affects the decision to go to college in various ways. As described by Becker and Tomes (1986) more educated parents are generally wealthier; their children are therefore less likely to be financially constrained than children from less educated parents. This argument of financial constraint is the crux of financial support policies. However, Cameron and Heckman (1998) for the US or Chevalier and Lanot (2002) for the UK show that the effect of financial constraints on educational choice is less important than the effect of family background (mainly parental education). This suggests that other arguments put forward by social scientists to explain the link in educational attainment between generations are also of importance, basically, as reviewed by Herrnstein and Murray (1994) more educated parents provide a “better” environment and a role model for their children15. There is
15 There has been a recent surge on research on the determinants of the intergenerational link between generations. The main focus is currently the debate on whether this relationship stems from nature or nurture. As more educated parents are likely to be more able and may transmit this ability genetically, researchers have been studying whether the intergenerational link is due to a positive effect of education per se or mostly to the inheritance of generic background. Behrman and Rosenzweig (2002) advocates that most of the effect is purely genetic (at least for mothers) while Chevalier (2003) concludes that the nurture effect is of importance. However, this debate is beyond the scope of the current paper.
a wealth of evidence on the positive relationship between parental education, especially the mother’s, and offspring’s education16. The elasticity for intergenerational mobility in education ranges from 0.14 to 0.45 in the US (Mulligan, 1999) and 0.25 to 0.40 in the UK (Dearden et al., 1997).
Here, we will interpret the parental education effect in a broad term, as we do not include measures of the family wealth when the child was taking his educational decision. Hence, the parental education will also capture any possible wealth effects.
The proportion of the population going to college varies substantially between these countries, as reported in Figure 13. While on average 27% of the population is found to have some college education, this proportion is less than 10% in Italy and four times higher in the USA. Figure 13 also highlights country differences in the evolution of tertiary attainment over time. Splitting the populations into almost equal halves (less or above 40), the average gain in the proportion of the population going to university is 3 percentage points. Four countries gained more than 10 percentage points between the two cohorts; they are Canada (French speakers) (20.7), Switzerland (French Speakers) (13.8), Switzerland (Italian speakers) (11.8) and Belgium (Flanders) (11.3). For another four countries, there was no gain (Denmark, Hungary and Switzerland (German speakers) or even a loss (Germany) in educational attainment. So there was no clear trend on the evolution of educational attainment over the period.
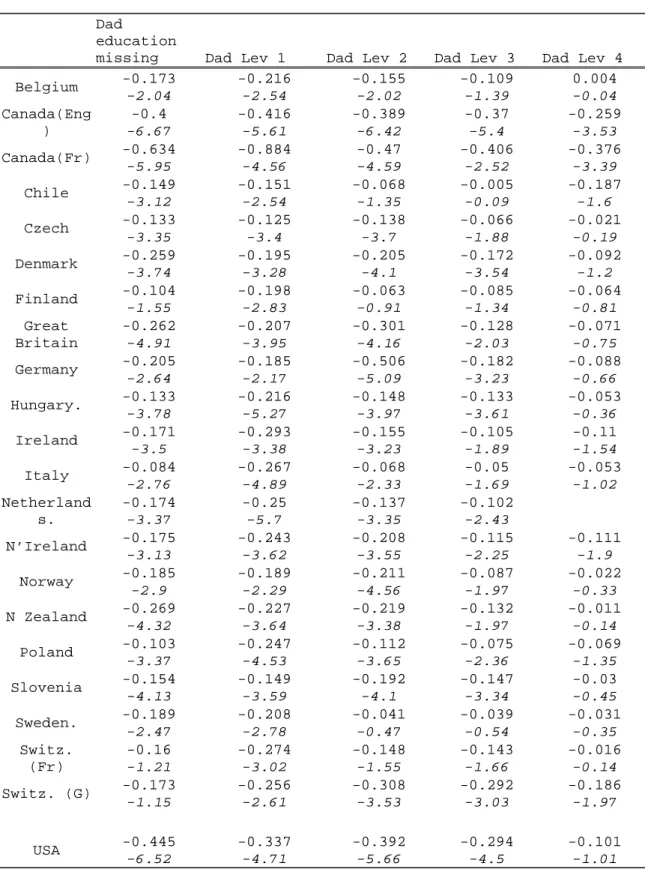
Tables 7 and 8 report for each country and gender, the estimated marginal effects of the paternal education on the probability of getting to university17. The reference category is having a father with the highest education level, the estimated parameters therefore measure the penalty associated with having a less educated father. In a more egalitarian/meritocratic country, parental background should have less impact on the likelihood of getting to university than in less equal countries.
We first discuss the results for men. For all countries and level of education, we observe a penalty for having a less educated father, however, in a few cases this effect is not linear. The most dramatic example of a non-linear relationship is Chile, where having a father with education level 4 is associated with a 19 percentage points reduction in the probability of getting to university, but having a father with level3, has no negative effect. This pattern is difficult to interpret. For other countries, the non-linearity is less marked and usually not statistically significant.
To compare the equality of educational opportunities between countries, we rely on two methods. The first is to focus on the penalty associated with a given level of paternal education, for example on the penalty associated with having a father with secondary education compared to university credentials. The second method is to report the education level associated with a reduction of 15 percentage points in the probability of obtaining a university degree.
16 See Behrman (1997) for an extensive review of this literature, focusing mostly on the US and developing countries. See also Mare (1996).
17 The complete sets of estimates for each country are available from the authors. The maternal effects are not reported in this paper as they led to similar conclusions as the paternal effect
According to the first measure, the most egalitarian countries are Chile, Italy and Sweden and the most unequal are Canada, the US and Switzerland (but not the French speaking part). With the exception of Chile, this is conformed to expectations and previous evidence in the literature. Other blocks of countries are of interest. Nordic countries appear to be rather equal. With the exception of Denmark, having a father with secondary education is associated with a penalty lower than 10 percentage points. The Central and Eastern European Countries are less homogeneous. The expectation here is that their communist past should have made the distribution of education in these countries relatively egalitarian. This is observed for Czech Republic and Poland but less for Hungary and Slovenia.
This is a somewhat different result to that noted by Müller who identified Poland and Hungary as one block of similar countries. Their similarity in development resulted from their common policy of communism and their adaptation to Soviet philosophies of education.
Focusing on the level of paternal education associated with a drop of 15 percentage points in the probability of having a college education, the countries were parental background has the strongest effects are Canada, Switzerland (not the French speaking area) and Chile. On the previous measure Chile was the most egalitarian country, the discrepancy between the two measures for this country is rather uncharacteristic as a rank correlation rejects the null hypothesis that the two measures are independent (Table 9). On this measure, the Czech republic is the most equal country as no paternal education background is associated with a drop in the probability of getting to higher education higher than 15 percentage points.
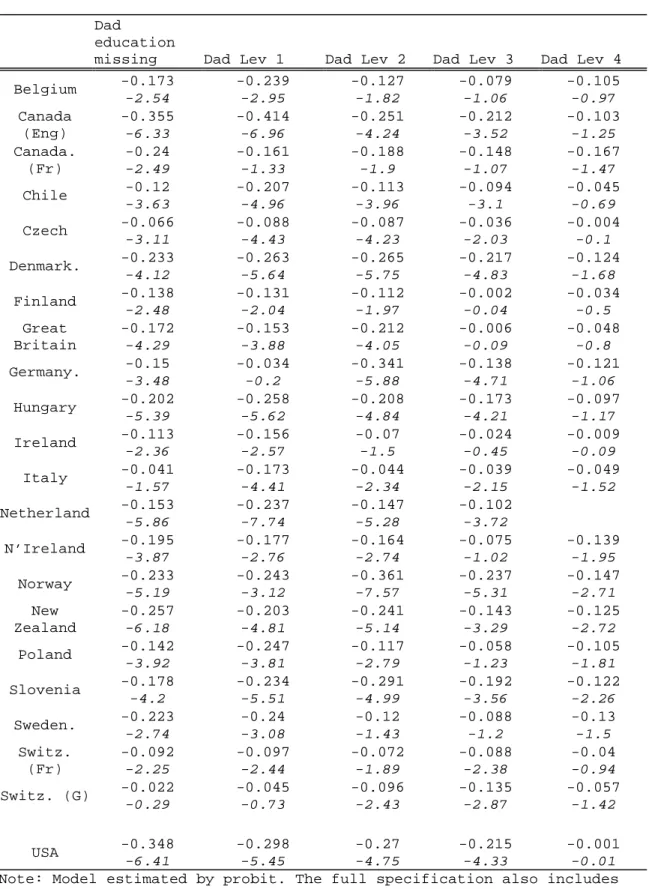
The intergenerational link appears to be weaker for women, as the negative effect associated with not having a father with the highest educational level tend to be smaller than those estimated for sons. Also, for 5 countries, there is no level associated with a drop in the probability of attending college higher than 15 percentage points. This reduced intergenerational tie between father and daughter compared to father and son has also been found in the literature (Behrman’s review, 1997).
Based on the first measure, the nations with the lowest penalty for having a secondary educated father are Finland, Britain and Ireland. The last two countries are usually described as “society of class”, so their apparent equality in higher education is rather surprising. On another level, Müller identified Britain and Ireland as a block of nations with similar educational distributions. There are differences between the two countries however. Tradition in Britain, as Müller noted, relied to a limited degree on education for recruitment. In Ireland, up until the advent of free education in 1967 and beyond, education, especially in rural areas would have had a limited value.
Working on the family farm or family business would have been viewed as a more rational investment. On a note of caution, Müller noted that from the oldest to the youngest cohort in these countries the proportions of those who received only elementary education strongly declined whereas the proportions with intermediate and higher education increased.
The bottom of this ranking is also surprising with the US, Denmark and Norway being the countries where the intergenerational link is the strongest. The reduced link
between father’s and daughter’s educational attainment may be responsible for some of the surprising results in this ranking. However, these results are confirmed with our second measure of intergenerational effect, since Canada, Norway and Denmark are the countries where for women having a father with education level 3 or 4 is associated with a reduction in the probability of going to university higher than 15 percentage points. On the other tail of the ranking distribution, in Switzerland, Czech Republic or Finland, no paternal education level is associated with such a penalty.
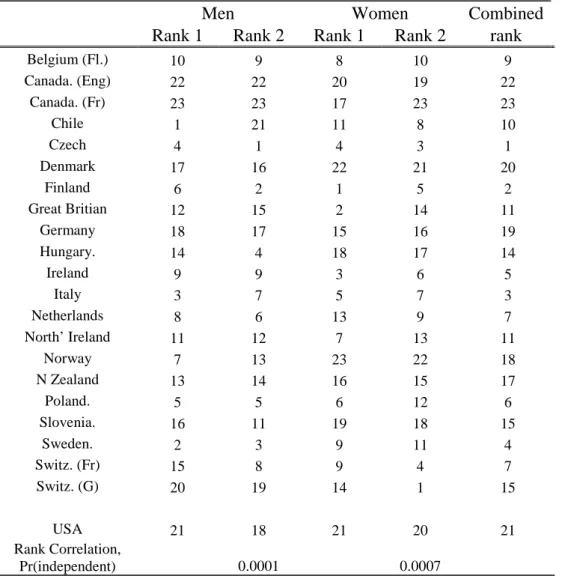
To check the consistency of the two measures of equality of opportunities in education, we report the country ranking by gender in Table 9. A Kendall test of the rank independence rejects that for men and for women the two measures of equality are independent. If the intergenerational educational link is due to institutional constraints, we expect the country ranking to be similar by gender. On the other hand, if the paternal effect is due to a role model or broadly speaking a nurture effect of education on the way children are brought up, then it is possible that differences in the intergenerational link between father and son, and between father and daughter could lead to variations in the country ranking. The Kendall rank correlation for the first ranking confirms the assumption of institutional effect but the independence of the second ranking measure between men and women cannot be rejected at the 5% level (but is rejected at the 10% level). So there is mixed support for the intergenerational link in education stemming from institutional effects.
The last column of Table 9 reports an aggregate ranking based on the sum of the country rankings for the two measures and both genders. Overall, the most egalitarian countries are the Czech Republic, Finland, Italy, Sweden and Ireland, while the less equal are Denmark, Canada and USA. Whilst Finland and Sweden conform to the Nordic model of egalitarian societies, Norway and Denmark are marked by a strong inter-generational link in educational achievement. Similarly, the evidence regarding the Central and Eastern European Countries are mixed, with Czech Republic and Poland being among the most egalitarian countries and Hungary and Slovenia being less so.
Since this section has provided estimates of the marginal impact of parental education on access to tertiary education, a natural question to ask is whether these marginal effects tell a similar story to that of the mobility indices used in the previous section.
To test this we did a Kendall test for rank correlation between the final column in Table 9 (the combined rank) and the two indices of mobility. In neither case could we reject independence. So based on these estimates marginal and average mobility are unrelated.
Evolution of equality over time
As highlighted with Figure 13, most countries have experienced an increase in the proportion of the population achieving tertiary education and most countries currently have policies of increasing access to higher education. However, a question of interest is whether those policies are associated with an increasing access to higher education children from less favoured background. Here, we propose to test this assumption by comparing the paternal effect in access to tertiary education over-time. A model where access to university was made universal should be associated with a reduction in the effect of paternal education on the choice to attend tertiary education. Whilst in
a model, where the expansion of tertiary education is due to more favoured children getting in, we will observe no reduction (or even possibly an increase) in the paternal education effect.
In order to obtain statistically significant results for each cohort, we pooled men and women. The results of this set of regressions are summarized in Figure 14, which reports the estimated penalty for having a father with secondary education on the probability of reaching tertiary education by cohort. For 9 countries, the paternal effect has decreased, the largest drop is recorded for Britain, where for the younger cohort, the paternal effect is basically nil. For Canada and Switzerland (not the French speaking area) the intergenerational link has become much stronger between the two cohorts. For example for French Canadian, the penalty on the probability of gaining tertiary education associated with a father having secondary rather than the highest level of education, jumped from 22 to 52 percentage points.
In the Central and Eastern European countries access to tertiary education has become more dependent on paternal education. Since the older cohort would tend to be from the pre-communist era we can test the Socialist transformation hypothesis. As expected we find that at least for Poland and Slovenia the marginal penalty associated with not having a university educated father has increased. With the exception of Norway, the Nordic countries have become more egalitarian.
These results cast doubts on the idea that the expansion of tertiary education has led to a reduction of the intergenerational link. In order to shed some lights on this issue, Figure 15, plots the cohort differences in the proportion with tertiary education and the estimated paternal education effects. There is no clear pattern in the evolution of access to tertiary education in relation to the intergenerational effect. In a large number of countries, the expansion of access to higher education has been concomitant with an increase in the effect of paternal education (becoming more negative, as Figure 15 reports penalties associated with not having a father with the highest educational level).
6 Conclusions
To know a person’s education is to know a lot about a person. It is informative about their occupation, their income, their attitudes to a variety of topics, where they are likely to live and who they are likely to marry. It also tells you something about their offspring. There is a universally strong positive correlation between the education of parents and their children. This paper seeks to quantify the latter relationship for a large number of countries using a variety of methodologies. Using scalar indices of educational mobility as movement between generations and mobility as equality of opportunity we show the following:
• While these forms of mobility are positively correlated, they are far from identical. One needs to think about what form of mobility one is interested in choosing an index.
• There appears to be a negative relationship, if anything, between mobility and educational inequality. This is not consistent with the incentive trap theory discussed above.
• The relationship between mobility and labour market incentives is weak. The incentive trap theory would predict that low returns to education would generate low mobility. We find no strong relationship either way.
• Mobility tends to higher for men than women. Educational inequality, by contrast, seems to be much the same for the two sexes.
• There is some evidence that mobility - as equality of opportunity- has risen over time but mobility as movement is relatively unchanged. Increases in mobility have tended to be associated with those starting from a lower starting point. This does not imply convergence however.
• Turning to the analysis of marginal effects, the expansion of access to tertiary education is not always associated with an increase in mobility.
• Differences in marginal effects by sex suggest that the intergenerational link is not solely due to country specific institutions.
• The increased penalty associated with poorly educated parents in the four transition economies is consistent with the socialist transformation hypothesis.
• Marginal and average measures of mobility are not correlated.
7 Tables and Figures 2-12
Table 1 Correlation of the four indices n=20 | Bart Ml Gini Cov ---+--- Bart | 1.0000
Ml | 0.3138 1.0000
Gini | -0.2816 -0.3936 1.0000
Cov | -0.4662 -0.5820 0.6133 1.0000
Table 2 Tests of rank correlation: Kendall’s tau Gini Cov
Bart -0.3766 -0.1948 (0.0153) (0.2147) Ml -0.2000 -0.3579
(0.2300) (0.0297)
The number in parentheses is the p value of a test for independence under the null.
Table 3 Descriptive Statistics by sex Males
| Obs Mean Std. Dev. Min Max ---+--- Bart | 20 .9305866 .1511479 .6557019 1.095383 Ml | 20 .6877705 .1015067 .489484 .8927329 Gini | 20 .164585 .034248 .12669 .27383 Cov | 20 .3651245 .1119309 .24068 .63526 (B) Females
| Obs Mean Std. Dev. Min Max ---+--- Bart | 20 .8999896 .1429455 .5458524 1.065197 Mlnew | 20 .6715682 .0799508 .5361774 .8882126 gini | 20 .158682 .0337476 .11496 .24873 cov | 20 .360218 .12513 .21164 .6961
Table 4 Tests for rank correlations between indices by sex
Males
Gini Cov Bart -0.0842 0.0316
0.6265 0.8711 Ml -0.0947 -0.4211
0.5813 0.0104