Development at the expense of the local population
A case study from Boeung Tumpun Lake, Phnom Penh (Cambodia)
Stiftung Asienhaus
Imprint
Title: Development at the expense of the local populations
A case study from Boeung Tumpun Lake, Phnom Penh (Cambodia) Published by: Stiftung Asienhaus
Hohenzollernring 52 50672 Cologne, Germany Tel.: +49-(0)2221-716121-0 Fax: +49-(0)2221-716121-10 http://www.asienhaus.de asienhaus@asienhaus.de
All rights reserved
Concept and design: Chanika Ronczka
Typesetting and layout: Klartext Medienwerkstatt GmbH, Essen (http://www.k-mw.de) Photo Credits: © Stiftung Asienhaus
© July 2018, Stiftung Asienhaus, Hohenzollernring 52, 50672 Cologne, Germany This work is published under the Creative Commons License 4.0 (CC BY-SA 4.0).
Gefördert mit Mitteln des evangelischen Kirchlichen Entwicklungsdienstes.
2
Development at the expense of the local populations
A case study from Boeung Tumpun Lake, Phnom Penh (Cambodia)
We would like to thank the residents of the Boeung Tompun Lake, and the participants of the research, for their assistance in providing invaluable informa- tion in support of this report.
3
Table of contents
Executive Summary
6Tables – Figures – Abbreviations
7Chapter 1 – Introduction
81.1 Introduction 8
1.1.1 Behind the Development of Boeung Tompun
1.1.2 Boeung Tompun Lake’s Importance 8
Local People 8
Environment 9
1.1.3 Key Issues of the BTL’s Development 9
Forced Eviction 9
Flooding 10
Chapter 2 – Methodology
112.1 Overall Method 11
2.2 Data Collection Methods 11
2.2.1 Primary Sources 11
a. Observation Survey 11
b. Community Representative Survey 11
c. Communities Survey 11
Sample Design 12
d. Further Interview and Focus Group Discussion 13
2.2.2 Secondary Data Sources 13
2.3 Limitations 13
Chapter 3 – Findings
143.1 Overview 14
3.2 Key Findings 14
3.2.1 Observational Survey Key Findings 14
3.2.1.1 Community Access and Structure 14
3.2.1.2 Hazards Present in the Community 15
3.2.1.3 Assessment of Development 16
4 Table of contents
3.2.1.4 Environmental Degradation 16
Environmental Impact of Infilling Lakes 17
3.2.2 Communities Survey Key Findings 18
3.2.2.1 Demographic Information 18
3.2.2.2 Awareness and Knowledge of Development 20
3.2.2.3 Change in Community Circumstance 21
3.2.2.4 Overall Situation and the Future 23
3.2.3 Key Findings Summary 24
3.3 Urban Development Master Plan 24
Chapter 4 – Conclusions and Recommendations
254.1 Conclusions 25
4.2 Recommendations 25
Local and National Authorities 25
Non-Governmental Organizations and Civil Society Groups 25
Urban Poor Communities 26
Annexes
271. Community Rep Survey 27
2. Initial community discussion questions 28
3. Observation Servey 29
4. Communities Housegold Questionnarie 32
5. FGD Checklist 38
5 Table of contents
The on-going development of Boeung Tompun Lake area (BTL) in the south of Phnom Penh will have impacts upon local residents’ land, livelihoods and tenure security. This research report aims to deter- mine the impact that development is having on BTL residents’ living standards and to highlight their con- cerns for the future.
There is a huge lack of transparency around this devel- opment that comes at the expense of the people living in this area. The development is connected to human rights violations (e.g. lack of rule of law, child labour, forced eviction) and thus repeats the same mistakes that were previously made with the development of the Boeung Kak Lake area in the north of Phnom Penh.
Until today the investor (ING Holding) failed to properly address requests for information from NGOs and local population.
At 2,500 hectares, Boeung Tompun Lake is one of the largest natural lakes in Phnom Penh and is home to tens of thousands of people. The following report focuses on 13 communities, whose boundaries account for 5,536 households. Filling in this lake has tremen- dous environmental impact. Together with the already filled Boeng Kak Lake Phnom Penh will miss huge water reservoirs and a natural flood prevention site.
The observation survey in this report found that 46%
of development within communities was partially com- plete, with construction ongoing. In another 46% of communities, no development was witnessed. Devel- opment was completed in the remaining 8% of com- munities.
60% of respondents in the communities’ questionnaire were aware of development, leaving a significant 40%
who indicated that they were not. 57% of those who were aware of development said they were officially informed.92% of respondents who were aware of devel- opment were also aware of how the land was to be developed – the most frequent response was condo- minium development (29%).
When questioned on their opinion towards the general development of Phnom Penh, residents responded to indicate that they often don’t oppose development – 29% of respondents agree that development is bene- ficial for everyone in the city. 38%, however, disagree that development is beneficial for everyone. 47% agree, and 8% strongly agree, that development only benefits wealthy people. Of the 19% of people to respond when asked to openly comment on development in Phnom Penh, 25% said people should not face forced eviction without proper compensation.
Since infilling the lake, general living conditions for 45% of respondents have remained the same. 29%
have reported improvements, and 27% reported gen- eral living conditions had worsened. Similarly, 41% of respondents reported their housing conditions had remained the same since infilling the lake, but 39%
have experienced worsening housing conditions. The deterioration of living conditions is likely linked to the increased severity of flooding in the communities, with 44% reporting that flooding has worsened since the infilling of the lake began.
61% noticed little difference in income opportunities.
However, of those who reported decreased income opportunities, 17% experienced worse income oppor- tunities and 5% experienced much worse. This could be explained by those employed in the second most common occupation, farming (14%), where infilling the lake has prevented the growing of aquatic crops such as morning glory and lotus. When asked what the most severe impact on the community has been since the infilling of the lake, residents’ top three responses were: flooding (29%), decreased income (14%), and threat of eviction (9%).
More positively, the study found that since infilling the lake, relationships within communities have improved.
42% reported relationships with neighbors were better, while 5% felt relationships were much better. 50% felt there was no change in relationships, and only 3% felt relationships had worsened.
Executive Summary
Tables – Figures – Abbreviations
Tables
Table 1: Sample size and design 12
Table 2: BTL communities overview 14
Table 3: Hazards present in the 13 target communities 15
Table 4: Demographic information 18
Table 5: Respondents’ occupation 18
Table 6: Goods sold by sellers 19
Table 7: Household demographics 19
Table 8: Number of earners per household 20
Table 9: Intended development at various BTL locations 20
Table 10: Summary of living conditions and residency change since development 22
Table 11: Issues with BTL homes 22
Table 12: Summary of social circumstance change since development 23 Figures
Figure 1: Community access route 14
Figure 2: Stage of development 16
Figure 3: Total household average monthly income 19
Figure 4: Communities’ plans for the future 23
Abbreviations
Boeung Tompun Lake (BTL)
Focus group discussion (FGD) Key informant interviews (KII) Municipality of Phnom Penh (MPP) Non-government organisations (NGOs) Semi-structured interviews (SSI)
7 Chapter 1 – Introduction
Chapter 1 – Introduction
1.1. Introduction
The following report examines the on-going urban development of Boeung Tompun Lake (BTL) and the surrounding area. The purpose of this research is to examine the impact this development is having on the residents of BTL, and report on the most problematic issues facing the affected communities.
BTL is one of the largest natural lakes in Phnom Penh.
It is situated in the Meanchey district approximately seven kilometres south of central Phnom Penh This location offers families affordable housing close to the city centre, where employment and education opportunities are typically greater than in Cambodia’s rural locations.1 The Boeung Tompun area is roughly 2,600 hectares in size, which includes 520 hectares of surface water that is used by local people for fishing and growing aquatic crops such as morning glory (water spinach) to be sold at markets.2 It is home to thousands of families, who have been settling in the area since 1975, and approximately 5,5363 households in 13 target communities used in this study. Residents have built homes from wood, brick, and concrete, on the banks of the lake or positioned on stilts above the water.
As the area is home to many people and the impact of development in the area will likely affect them, this report has sought to conduct further research into the broader implications of the BTL development. The find- ings are that the lake area has a continued importance to both people and the environment.
1.1 Behind the Development of Boeung Tompun BTL and the surrounding land within the Boeung Tom- pun area is, by law,4 categorised as State Public Land.
The Cambodian Land Law states that “[w]hen State
1 Rhoads, C. and Odom, S. (2014). As Lake Disappears, a Development Dilemma. Cambodia Daily. [online] Avail- able at: https:// www.cambodiadaily.com/ archives/
as-lake-disappears-a-development-dilemma-62718/
2 Sahmakum Teang Tnaut (2015). F&F#25: Boeung Tompun Lake: A future Unknown. Phnom Penh.
3 Information was obtained via telephone call with local authorities, who completed comprehensive population surveys in 2016 for the communal election.
4 Cambodian Land Law 2001.
public properties lose their public interest use, they can be listed as private properties of the State by law on transferring of state public property to state private property.”5
It is now believed that a satellite city will be built in the area.6 The satellite city will comprise of: residen- tial housing, office facilities, and retail space, offering a “centrally based area that methodically includes all that is required to live a safe, peaceful, and enjoya- ble life, within the comforts on nature”.7 Development commenced in 2009, and the sand being used to fill in the lake continues to encroach further into the com- munities. Because of this development, thousands of families could face eviction.
1.2 Boeung Tompun Lake’s Importance Local People
BTL residents have been fishing and growing aquatic crops ever since they began settling in the area. Its importance to residents as a source of income is cru- cial to its livelihood, where in one community (Prek Takong 1) residents estimate that 70 % of the com- munity depend on BTL for income, earning between 70,000–80,000 KHR (USD$17-$19) per day. However, res- idents fear the infilling of BTL will negatively affect their income and that they may struggle to find alternative employment. One resident commented that “the farm- land is smaller and we can’t produce as much. Now the water is little, and it’s dirty and smelly, so the crops don’t grow as well. I used to be able to earn $100 each time I went to market, but now it’s more like $25.”8 An additional consequence of this reduced income is child labour, where families are forced to send their chil- dren to work, removing them from school in order to supplement the lost income.9 With the on-going devel- opment of BTL, local families continue to suffer from
5 Ibid, Article 16.
6 ING Holdings Ltd. (2017). Profile | ING Holdings. [online]
Available at: http:// www.ing-holdings.com/ profile.
7 Ibid.
8 Forsyth, L. and Bright, G. (2016). The Vanishing Lakes of Phnom Penh. [online] The Diplomat. Available at:
http:// thediplomat.com/2016/02/ the-vanishing-lakes- of-phnom-penh/
9 Ibid.
8 Introduction
reduced income, and a worsening of living standards as a result.10
Environment
Aquatic plants (morning glory, lotus, water lily), are an essential element of filtration in Phnom Penh’s waste- water treatment. Wastewater from the city is pumped out to wetlands, such as Boeung Tompun. From there it flows through dense vegetation, which acts as a filtra- tion system, capturing nutrients from the wastewater before it makes its way into the Tonle Bassac River.11 These natural, “low-cost, effective biological treatment plant[s],”account for approximately 80 % of Phnom Penh’s sewage.12
Another significant importance of these large bodies of water is their ability to act as natural reservoirs, capa-
10 Communities survey 2017.
11 See above n 2.
12 Perez-Solero, R. (2017). The eschatological reality behind Phnom Penh aquatic vegetables. [online] News4europe.
eu. Available at: http:// www.news4europe.eu/6358_
life/4440515_the-eschatological-reality-behind-phnom- penh-aquatic-vegetables.html
ble of storing large quantities of rainwater. This helps control flooding within the city centre and greater Phnom Penh, particularly during the rainy season.13 1.3 Key Issues of the BTL’s Development
Forced Eviction
A 2011 study identified 77 eviction sites from the past two decades in Phnom Penh.14 This number will con- tinue to increase as development is on-going in the city.
The 13 communities situated within the development boundaries of BTL have expressed fear of forced evic- tion. One community (Prek Takong) had already faced evicted in 2005 and 2006, though having returned to live near the eviction site again, they now face the threat of further eviction.
13 See above n 1.
14 Sahmakum Teang Tnaut, (2016). Promises Kept? A study on the Development of 77 Eviction Sites in Phnom Penh. Phnom Penh: Sahmakum Teang Tnaut. [online]
Available at: http:// teangtnaut.org/ wp-content/
uploads/2016/12/1PK-Final-Report_V12.1_final-edits_
formatted518907-1.pdf Large areas of sand now sit where the lake used to be.
9 Introduction
Urban poor people are a vulnerable demographic, who have limited skills and resources to negotiate with development corporations and authorities and can also be more vulnerable to intimidation.15 A 2016 report found that living conditions of people who had faced eviction had, overall, worsened since being evicted.16 Living environment, flooding, and food security were key drivers reducing living conditions for evictees.17 Once evicted, communities that are relocated face further hardships, a key one being the distance reloca- tion sites are located from their original homes.18 Not only are the living conditions often worse, but reduced access to infrastructure and services places further hardships on evictees. Limited access to healthcare and education facilities, employment opportunities and reliance on private water and electricity (that is often costlier than state sources), are all potential issues faced at the relocation sites.19
Perhaps the greatest issue with forced eviction is the lack of fair compensation received by those evicted.
15 Information based on discussion with community resi- dents during 2017 research.
16 See above n 14.
17 See above n 14.
18 Mgbako, C., Gao, R., Joynes, E., Cave, A. and Mikhailevich, J. (2010). Forced Eviction and Resettlement in Cambodia:
Case Studies from Phnom Penh. Wash. U. Global Stud. L.
Rev. 39, 9(1).; Sahmakum Teang Tnaut, (2012). Resettling Phnom Penh: 54 – and counting? F&F#21. Phnom Penh.
19 See above n 16.
Often, the evicted families receive little financial, or otherwise, compensation for their losses. The issue of land titling is important in this regard, and even those with official land titles are not guaranteed fair compensation. Toul Sangke A, for example, was evicted and relocated in the north of Phnom Penh in 2008. They had received official land tenure doc- umentation from the Municipality of Phnom Penh (MPP), but received only USD$500 in compensation after being forcibly evicted.20 In BTL, the lack of pub- lic consultation and information has left families in fear of losing their homes, and reports suggest that the construction company has warned families that should they reject the compensation offered to them, they will be forcibly evicted and receive no compen- sation at all.21
Flooding
With lakes being filled-in to satisfy urban develop- ment, flooding has been worsening, and is expected to continue to worsen as more of Phnom Penh’s lakes vanish.22 Residents of BTL have been facing increasing levels of stagnant, dirty flood water, endangering their health and safety, and impacting upon their standard of living.
20 Ibid.
21 See above n 2.
22 See above n 2.
10 Introduction
Chapter 2 – Methodology
2.1 Overall Method
This report identified the 13 target communities through publicly available information on the devel- opment of BTL by the investor ING Holding.1 Through using GPS technology, the 13 community locations were verified. Exact boundaries, however, could only be esti- mated since the communities do not possess precise information on the administrative boundaries. 1,800 households within these 13 communities are located within the boundary of development itself, while the remaining 3,736 households are located nearby.
2.2 Data Collection Methods
2.2.1 Primary Sources
First-hand information presented in this report has been collected using two tools. These are semi-struc- tured interviews (SSI), and key informant interviews (KII).
a. Observation Survey
Observational surveys were conducted by researchers for each community and took approximately 10 min- utes to complete. One researcher completed the 13 observation surveys whilst visiting each community to undertake the communities’ household survey. Each survey was completed by walking around the commu- nity and noting the observable condition of the com- munity as outlined by the survey questions. Findings were discussed with and confirmed by village chiefs and community leaders.
The observation survey was conducted to assess the physical accessibility of the communities, and the quality of infrastructure by identifying materials used for such infrastructure within the community. It also served to identify apparent environmental hazards as a result of development in the area and aided in devel- oping an inclusive community profile.
1 ING Holding. [online] Available at: http:// www.ing- holdings.com/ overproject#!prettyPhoto
b. Community Representative Survey
Prior to undertaking in-depth research in each com- munity, a community representative survey was con- ducted. This survey took place via a telephone call between one researcher and the community leader or representative of each of the 13 target communities, to obtain an overview of each community.
Given that the questions asked in this survey required an accurate understanding of community details, only the community leader/ representative was interviewed, as they were the person most likely to have this knowl- edge. The survey aimed to identify facts and legal doc- umentation such as: community settlement year, num- ber of households/ families, and current eviction status.
c. Communities survey
SSIs were first undertaken at each of the 13 target com- munities in BTL in order to develop the community sur- vey. This involved two researchers going to each com- munity and facilitating an open discussion with avail- able and willing community residents for the purpose of opening a dialogue between the researchers and BTL residents. Community residents were contacted in advance2 to determine a suitable date and time for these discussions to occur, which took place in locations convenient to residents within each community. Six key points were focused on for this discussion: opinions on general development; knowledge and awareness of BTL development; general opinions and emotions towards BTL development; community circumstance; commu- nity action; and considerations for the future.
A draft questionnaire was then created using results from these initial interviews. This was then tested with three communities (Deum Svay, Prek Talong 2 and Khva) and adjusted based on the outcomes of the interview (i. e. were all questions understood by both interviewer and interviewee, and did the questions yield useful results?). Once the required adjustments were made and a final version completed, a team of six research- ers visited 13 communities over the course of nine days to interview residents in BTL. Each interview was com-
2 Resident contact details were collected in previous years for internal documentation.
11 Methodology
pleted in an average of 40 minutes, and approximately 54 questionnaires were completed each day. Resident contact details were also collected, to allow for follow up calls if necessary. Researchers did not encounter any unwillingness to participate from the BTL residents.
Once data had been collected and inputted into Micro- soft Excel, SPSS3 was used to analyse the results.
To ensure data collected from the sample in each com- munity was representative of the whole community (which could be quite large), collection was conducted in three separate areas to account for potential differ- ences in ‘clusters’ of households in different parts of the community. When approaching residents for inter- views, researchers were careful to not select clusters of respondents. They divided each community into three distinct segments thus ensuring each “area” within a community is represented, and interviewed residents, at random, around these segments.
Table 1: Sample size and design
3 SPSS is a specialised statistical software package used for logical batched and non-batched statistical analysis.
During this analysis, several tools were utilised, includ- ing: frequencies, descriptive response, and multiples response.
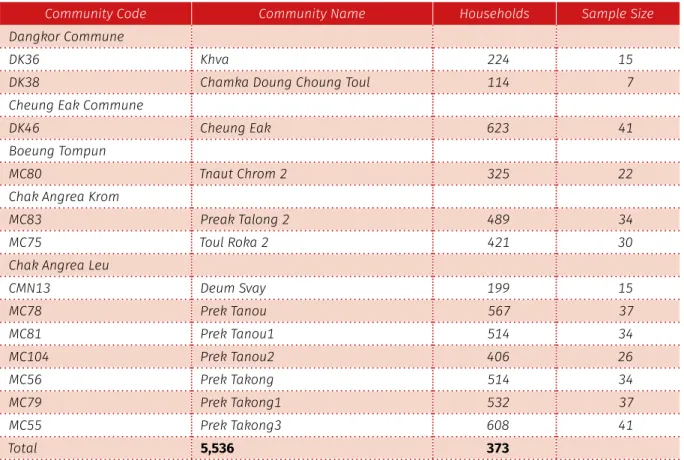
Sample Design
With limitations in resources (e. g. time and labour), all households in the 13 communities could not be interviewed. Therefore, a sample size has been calculated using the Yamane Taro formula:4
Where: n = sample size, N = total number of households, e = error tolerance (e= 0.05 based on the research condition).
The 13 target communities in BTL have 5,536 households in total. Given an error tolerance of 0.07, the sample size is:
4 Yamane, Taro. (1967). Statistics: An Introductory Analysis, 2nd Edition, New York: Harper and Row.
Community Code Community Name Households Sample Size
Dangkor Commune
DK36 Khva 224 15
DK38 Chamka Doung Choung Toul 114 7
Cheung Eak Commune
DK46 Cheung Eak 623 41
Boeung Tompun
MC80 Tnaut Chrom 2 325 22
Chak Angrea Krom
MC83 Preak Talong 2 489 34
MC75 Toul Roka 2 421 30
Chak Angrea Leu
CMN13 Deum Svay 199 15
MC78 Prek Tanou 567 37
MC81 Prek Tanou1 514 34
MC104 Prek Tanou2 406 26
MC56 Prek Takong 514 34
MC79 Prek Takong1 532 37
MC55 Prek Takong3 608 41
Total 5,536 373
Yamane Taro 1967, =[1+ ( 2)]
5536
[1 + 5536(0.052)] = 373
12 Methodology
One resident from each of the 373 households was interviewed for the communities’ questionnaire (no two residents resided within the same household).
Thus, when reporting the results, the term ‘household’
and ‘resident’ may be used interchangeably.
d. Further Interview and Focus Group Discussion Additional methods were used to capture qualitative data and to provide insight or further background information on the BTL communities.
Focus group discussion with BTL residents.
Sixteen residents (eight males and eight females) from 11 communities (Khva, Prek Takong 1, Prek Takong 3, Prek Tanou, Prek Tanou 1, Prek Tanou 2, Prek Talong 2, Toul Roka 2, Tnaut Chrom 2, Cheung Eak, and Deum Svay) participated in a focus group discussion (FGD). The FGD, which utilised semi-struc-
tured questions facilitated by researchers, sought to gain further insight into the responses received dur- ing the communities’ household questionnaire.
2.2.2 Secondary Data Sources
Secondary data used throughout this report has been obtained from various sources which include: NGO reports, national and international media articles, and other available publications.
2.3 Limitations
Researchers aimed to achieve greater insight from key stakeholders, such as the primary developer of BTL and the MPP. After several requests by researchers to involve these stakeholders, it became apparent their participation would not occur for the report.
13 Methodology
Chapter 3 – Findings
3.1 Overview
Data collected in the community representative survey is presented in Table 2 below, and gives a brief overview of the report’s 13 target communities.
Table 2: BTL communities overview
3.2 Key Findings
3.2.1 Observational Survey Key Findings
Observational surveys were conducted by a researcher at each of the 13 BTL target communities. The findings – which aimed to determine community access, infra- structure, safety and hazards, and potential environ- mental concerns – were discussed and confirmed with community representatives/ leaders to ensure accuracy.
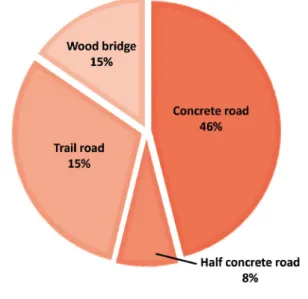
3.2.1.1 Community Access and Structure
Communities are accessed via various means,1 with concrete roads as the most common:
1 Note: Trail roads are typically dirt pathways that are yet to be constructed using concrete.
Most communities (54 %) are defined as ‘too narrow’. In Deum Svay, for example, there is only 1.5 meters width for maneuvering through the community. Additionally, 54 % of communities have grounds that are considered un-walkable (i. e. contains large muddy areas, lasting flood puddles, or large areas of sand).
Community Code
and Name Year of
Settlement House-
holds Population
(# female) Eviction
Status
CMN13 Deum Svay 1979 199 1,473 ( 966) Informal rumours of eviction
DK36 Khva 1984 224 1,120 ( 436) Formal notice of eviction
DK38 Chamkadoung Chong Toul 1982 114 570 (x)1 Informal rumours of eviction DK46 Cheung Eak 1979 623 2,668 (1,392) Informal rumours of eviction MC55 Preak Takong 3 1979 608 4,393 (2,960) No known threat of eviction MC81 Prek Tanou 1 1979 514 3,597 (2,370) Informal rumours of eviction MC56 Prek Takong 1979 514 3,467 (2,304) Informal rumours of eviction MC75 Toul Roka 2 1979 921 4,389 (2,271) Informal rumours of eviction MC78 Prek Tanou 1979 567 3,857 (2,611) Informal rumours of eviction MC79 Prek Takong 1 1980 532 4,093 (2,731) Informal rumours of eviction MC80 Tnaut Chrom 2 1986 325 2,729 (1,647) Informal rumours of eviction MC83 Prek Talong 2 1979 489 1,776 ( 908) Informal rumours of eviction MC104 Preak Tanou 2 1979 406 2,663 (1,800) Informal rumours of eviction
Figure 1: Community access route
14 Chapter 3 – Findings
The housing structures in BTL – which are predomi- nantly built using wood, brick, and concrete, on the banks of the lake or positioned on stilts above the water – appear to be stable2 in 54 % of communities. In the remaining 46 % of communities, however, observa- ble old and failing construction material indicates that many houses are becoming unstable and potentially dangerous to live in or be around.
3.2.1.2 Hazards Present in the Community
Various hazards within the community are cause for concern. Table 3 lists various, observable hazards, and their presence within the 13 communities.
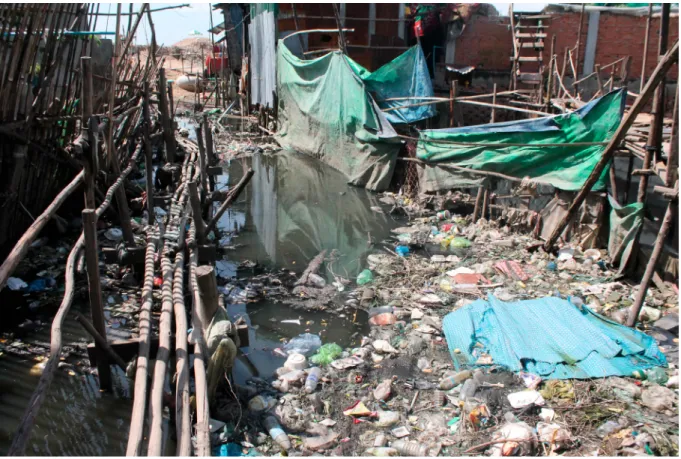
Due to the narrow layout of many BTL communities, waste collection vehicles from CINTRI (Cambodia’s pri- vate waste collection firm) cannot access households to collect trash, thus it is regularly thrown in piles within – or near – the community. Improper waste management is a severe issue, where trash piles attract
2 This was determined by observing the quality and stabil- ity of materials used (e. g. were structures falling apart, or leaning to one side, etc.)
vermin, spread disease and present a physical risk to walk near should they contain needles or dangerous items.3
Table 3: Hazards present in the 13 target communities
Hazard # Communities
with this hazard % of Total
Pot holes 2 15,4
Trash piles2 10 76,9
Standing water 5 38,5
Large amounts of
electrical wiring 1 7,7
Gambling 1 7,7
Another problem in urban poor communities is gam- bling, which can increase the risk of crime and reduce income security. While in this observational survey, gambling was only noted if physically observed, the
3 Wood, R. (2004). Phnom Penh struggles with its garbage.
The Phnom Penh Post. [online] Available at: http:// www.
phnompenhpost.com/ national/ phnom-penh-struggles- its-garbage
Residents in Preak Takong have constructed makeshift walkways to avoid trash and lasting flood puddles.
15 Chapter 3 – Findings
communities’ survey found that gambling was present, with 9 % of respondents reporting gambling to be an issue. Other security hazards reported include: alco- hol/ drug abuse (16 %), petty crime (7 %), domestic vio- lence (4 %), and violent crime (1 %).
3.2.1.3 Assessment of Development
All communities that are categorized as partially devel- oped are under active construction. Of the communi- ties that have witnessed complete or partial develop- ment, road rehabilitation/ expansion has occurred in 29 % of communities; residential areas have been con- structed in 57 % of communities, and a commercial area has been constructed in one community.
3.2.1.4 Environmental Degradation
Long term damage to the environment is more diffi- cult to observe, and thus only immediately observable damage has been noted. The most prominent issue in BTL communities is flooding of community sewage systems. The residents themselves have made many of these systems from repurposed material in the com- munity.4 Preak Tanou 1 is one such community that has constructed their own sewage system. During heavy/
prolonged episodes of rain, however, their makeshift sewage system cannot cope, and sewage spills out into the roads, and sometimes inside houses.5
4 STT 2016 Boeung Tompun Communities Survey.
5 In Tnaut Chrom 2, residents raised concerns during the FGD that their sewage system has been unable to func- tion efficiently since infilling the lake.
Figure 2: Stage of development
A resident of Preak Takong 1 walks through her flooded community.
16 Chapter 3 – Findings
In addition to the flooding of sewage systems, gen- eral flooding is a concern, particularly when water becomes stagnant and polluted thus attracting mos- quitos and spreading disease. Flooding is also prob- lematic for access to houses. In Preak Takong 3, resi- dents have experienced a worsening in flooding of their single 200 cm long sewage system. When the system floods, 30 % to 40 % of community members must pay
for someone to transport them and/ or their goods between the community and main road.6
Finally, the burning of trash piles is a notable environ- mental issue. Residents have resorted to burning their 6 STT – Community meetings 2017.
Environmental Impact of Infilling Lakes
Infilling large bodies of water, such as lakes and wetlands, affects the natural environment, impacting ecology, hydrology, and productive economic services. The physical and economic act of infilling gives little regard to the true value of these waters, and no provision for the costly consequences of displaced flooding and the loss of natural public infrastructure for wastewater treatment.
Natural wetlands – such as Boeung Tompun Lake – play a major role in wastewater treatment. A complex community micro-organisms – bacteria, virus, fungi, protozoans, and other very small organisms – feed on the organic matter of the sewage, and remove harmful contaminants and pathogens found in sewage. These critical microbes are found on the root surface of floating plants, such as water hyacinth, morning glory and water spinach.
However, the capacity of this natural treatment process depends on it not being overburdened by too much sewage. When the wetland area becomes too small (i. e. filled-in with sand), or the volume of sewage input increases due to a growing population, the microbial community does not have sufficient time to provide observable treatment. This is a process currently occurring in Phnom Penh’s Boeung Tompun Lake.
The damage infilling imposes on ecological systems can be severe. Each fish species, for example, needs a certain amount of dissolved oxygen in the water at all times to survive. When raw sewage flows into the warm, slow moving and seasonally low Tonle Sap and Bassac Rivers, the dissolved oxygen in the water available to fish drops significantly. This is because the microbial community, reacting to the sewage solution as food, grows explosively and their metabolism depletes the oxygen in the water. As a result, the fish die and an economically productive fishery is lost. So, not only does infilling the lake leave less spatial habitat for fish today, but also the quality of the water becomes degraded due to less natural treatment capacity from what is now likely an overload of sewage water.
A further issue with infilling lakes focuses on storm water management. This is a significant concern in Phnom Penh, largely due to the lack of sufficient pipe capacity under the streets. Historically, the city’s combined sewage and storm water flows have been received and treated by a wealth of wetland areas. However, with less infiltration into the ground due to more cemented areas, storm water flows have increased, and this puts more flow into the pipes and canals. As a consequence, flooding in and around the city has worsened.
Costless, maintenance-free treatment opportunities are forgone when the extent of the original wetland area is significantly reduced, and when the natural ecological/ microbial treatment system becomes overwhelmed with wastewater input. If the city’s increasing volume of untreated wastewater is discharged directly into the Bassac River, it may biologically kill the river for some kilometers, and create a bad riverine odor. This will have an effect on fish quantity and health, and those who rely on fishing these waters for income could suffer.
17 Chapter 3 – Findings
trash in the absence of it being collected. Scientific American reported that burning trash is a significant issue in developing countries that contributes neg- atively towards climate change. It reported “an esti- mated 40 to 50 per cent of the garbage is made up of carbon by mass, which means that carbon dioxide is the major gas emitted by trash burning”.7 This esti- mate will fluctuate on a case by case basis, but the issue remains present in BTL communities. Further, the burning of trash presents significant health risks for residents that inhale smoke, with much trash consist- ing of dangerous materials such as plastic, and with trash burning often occurring near houses and schools.
Damage to the environment is difficult to observe with- out significant and ongoing monitoring, and below is an overview of the general ecological impacts.
3.2.2 Communities Survey Key Findings
Researchers interviewed a total of 373 residents, from different households, from the 13 Boeung Tompun Lake target communities. The questionnaire focused on:
demographic information; awareness and knowledge of development; and change in community circumstance.
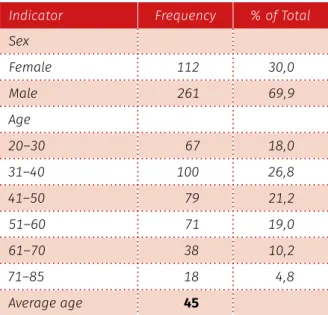
3.2.2.1 Demographic Information
Table 4: Demographic information
Indicator Frequency % of Total Sex
Female 112 30,0
Male 261 69,9
Age
20–30 67 18,0
31–40 100 26,8
41–50 79 21,2
51–60 71 19,0
61–70 38 10,2
71–85 18 4,8
Average age 45
7 Scientific American (2014). Burning Trash ad for Humans and Global Warming. Scientific American. [online] Avail- able at: https:// www.scientificamerican.com/ article/
burning-trash-bad-for-humans-and-global-warming/
Due to the randomized nature of interviewee selection (households were chosen at random upon arrival at each community, and one willing resident from each household was interviewed), there were no deliberate actions taken to ensure an even split between male and female respondents. The majority of BTL inter- viewees were male (70 %), and the most prominent age group 31–40 (27 %).
Table 5: Respondents’ occupation
Occupation Frequency % of Total
Seller 116 31,0
Farmer/ vegetable grower 53 14,2
Home-maker 48 12,9
Garment/ factory worker 27 7,2
Private company staff 22 5,9
Government staff 17 4,6
Construction worker 16 4,3
Retired 16 4,3
Moto-dop/ Tuk-tuk driver 13 3,5
Tailor 5 1,3
Chef 2 0,5
Financial support from son 2 0,5
Launderer 2 0,5
Mechanic 2 0,6
Musician 2 0,5
Priest 2 0,5
Beautician 1 0,3
Cleaner 1 0,3
Fisherman 1 0,3
NGO staff 1 0,3
Teacher 1 0,3
Trash collector 1 0,3
Other 22 5,9
Total 373 100
The most common occupancy of a BTL resident is a
‘seller’ (31 %). Sellers include those working in grocery stores, and those with small carts selling various goods.
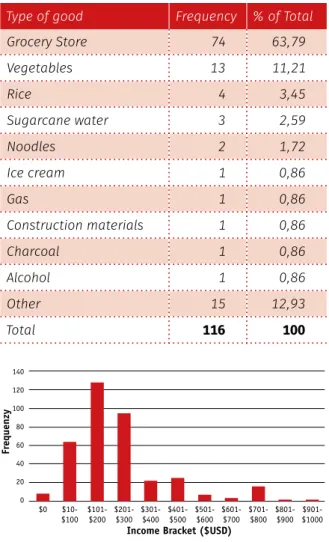
Table 6 identifies the goods sold by sellers who were interviewed.
Aside from residents who work for grocery stores, the most common type of goods sold by residents of BTL
18 Chapter 3 – Findings
are the crops grown on the lake. These ‘sellers’ retail vegetables grown by farmers, with farmers/ vegetable growers the second most common occupancy (14 %), while homemakers – those who look after the family household, cooking and cleaning for the family – are third (13 %). Homemaking is an occupancy dominated by women, but some males do undertake this role.
Table 6: Goods sold by sellers
Type of good Frequency % of Total
Grocery Store 74 63,79
Vegetables 13 11,21
Rice 4 3,45
Sugarcane water 3 2,59
Noodles 2 1,72
Ice cream 1 0,86
Gas 1 0,86
Construction materials 1 0,86
Charcoal 1 0,86
Alcohol 1 0,86
Other 15 12,93
Total 116 100
The current living wage per family in Cambodia is
$328.06 (KHR 1,341,860) per month, and $266.72 (KHR 1,090,964) per individual per month.8 The communities of BTL are defined as ‘Urban Poor’, cemented in the fact that earnings of most BTL households fall far below this family living wage. 295 households (79 %) obtain a
8 Trading Economics. (2017). Cambodia Living Wage Family | 2015–2017. [online] Available at: https://
tradingeconomics.com/ cambodia/ living-wage-family.
monthly household income falling within the $210-$300 income bracket or less.
161 households (43 %) earn below the suggested national minimum wage guideline for one person as outlined by the Royal Government of Cambodia. The guideline is marked against that received by textile workers, which as of 2017 is $153 per month (based on a 6-day working week).9
Noteworthy is the number of earners per household, which helps determine the above total household monthly income. 54 % of all households contain one to three adults (Table 7), and 47 % of all households have two adults generating income (Table 8).10
Table 7: Household demographics
Demographic Frequency % of Total Adults (16 years+)
Zero 0 0
One – three 201 53,9
Four – six 122 32,7
Seven – nine 38 10,2
Ten + 12 3,2
100 % Children (3–16 years)
Zero 118 31,6
One – three 224 60,0
Four – six 28 7,5
Seven – ten 3 0,8
100 % Infants (0–3 years)
Zero 293 78,5
One – two 73 19,6
Three – five 6 1,6
Six + 1 0,3
100 %
9 Thul, P. (2016). Cambodia raises 2017 minimum wage for textile industry workers. Reuters. [online] Available at: http:// www.reuters.com/ article/ cambodia-garment- idUSL3N1C51OD
10 Children who work to supplement household income were not included in these figures.
140 120 100 80 60 40 20 0
$0 $10-
$100 $101-
$200 $201-
$300 $301-
$400 $401-
$500 $501-
$600 $601-
$700 $701-
$800 $801-
$900 $901-
$1000
Frequenzy
Income Bracket ($USD)
Figure 3: Total household average monthly income
19 Chapter 3 – Findings
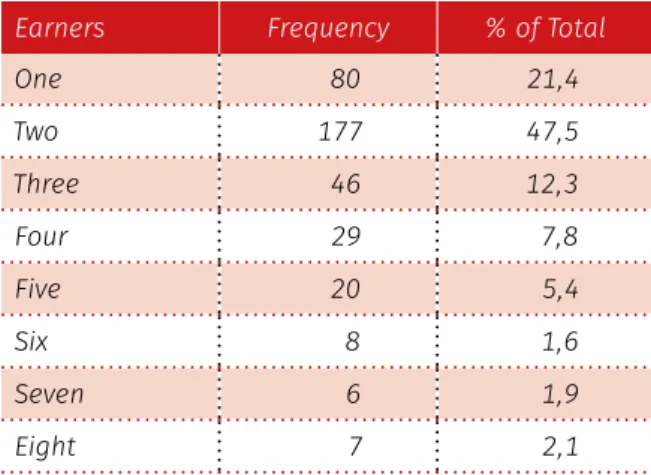
Table 8: Number of earners per household
Earners Frequency % of Total
One 80 21,4
Two 177 47,5
Three 46 12,3
Four 29 7,8
Five 20 5,4
Six 8 1,6
Seven 6 1,9
Eight 7 2,1
Though most households (69 %) have one or two earn- ers, 6 % have as many as six, seven, or eight earners. It could be assumed that those with more earners have a higher total household income, however the data shows this to be untrue, with little correlation between number of earners and income bracket.11
3.2.2.2 Awareness and Knowledge of Development 60 % of respondents reported that they were aware of intentions to develop the land, leaving a signifi- cant 40 % who indicated that they were unaware. Of the 60 % who were aware, 57 % said they were officially informed (3 % by government authority, 4 % by local authority, and 2 % by private company). 48 % said they were informed via informal channels, such as gossip in the community. However the researchers cannot verify this as a form of official communication.
Again, of the 60 % who were aware of the intended development, 92 % knew how the land was to be devel- oped. 2 % did not, and 6 % could not confirm if they knew or did not. Below are the responses given by res- idents indicating what is to be developed in the area.12 When questioned on their opinion towards the general development of Phnom Penh, residents that they do not entirely oppose development, and do understand the benefits of development. Of the 373 residents inter- viewed, 29 % agree that development is beneficial for everyone in a city. There are many that believe devel- opment is good overall, but feel not everyone will see such benefits – 38 % disagree that development is ben-
11 Appendix 3 displays the number of earners per house- hold in each income bracket.
12 Note: some development sites will contain more than one of the following, thus the total is not 206.
eficial for everyone in the city, and 47 % and 8 % agree and strongly agree, that development only benefits wealthy people. Residents of Preak Talong commented that development will be prosperous, but it will nega- tively affect our community,13 while 100 % of residents in attendance at the FGD stated that “people are afraid”, and “development is intimidating and causes tears” in communities that are negatively impacted by the changes currently taking place.
Table 9:
Intended development at various BTL locations Development to occur Frequency
Condominium development 85
Green City 46
Residential area 43
Road rehabilitation or expansion 42
Water reservoir building 29
Commercial area 14
Garden development 11
Canal rehabilitation or expansion 6
Bridge construction 5
Other infrastructure 4
No development plan 3
Market Building 3
Government building 2
Airport Building 1
Hotel Building 1
Fence Building 1
Stadium 1
Based on these results, it can be inferred that, while often urban poor commom unities do not outright oppose development, they do feel excluded and left behind in the fast-paced changing environment of their city. One resident of Cheung Eak discussed with researchers that she does not support development when it “causes suffering and homelessness”.14 Simi- larly, a resident of Deum Svay acknowledged develop- ment betters the city, but can “bring tears” to people when communities suffer as a result of development.
13 Community meetings 2017 14 Ibid.
20 Chapter 3 – Findings
Of the 19 % of people to respond when asked to openly comment on development in Phnom Penh, 25 % said people should not face forced eviction without proper compensation. Every resident present at the FGD stressed the importance of fair compensation, ask- ing particularly for “clear information of compensa- tion”. Fair compensation is a contentious issue in the event of forced eviction, but previous research finds that those who are forcibly evicted in Cambodia rarely receive fair compensation.15 Sufficient and fair com- pensation, as outlined in the 2001 Cambodian Land Law, is detailed as being “at market prices or replacement price”.16 Additionally, as outlined in Article 5, compen- sation must be given in advance.17 Residents of Preak Talong stated “the community wants the government to develop… [But] compensation must follow the market price”.18
One benefit of land titles is to ensure fair compensa- tion and efforts to obtain land titles should be made to increase residents’ bargaining power for fair com- pensation. Results from the communities’ household questionnaire show that 44 % of respondents under- stand the benefits of land titles, while 20 % and 36 % only somewhat understand or do not understand the benefits of land tenure respectively.
72 % of respondents are in possession of land titles. Of these, however, 92 % are soft titles (or certificates of occupancy), which offer less assurance and are signif- icantly easier for authorities to overrule.19 Of the 38 % without land titles, 39 % purchased their house without any land titles, while 32 % rent, 15 % own the land with- out land titles (having lived there for a long time), 9 % live on state land and so cannot obtain land titles, and 5 % have temporary occupation20 of the land.
Acknowledging that forced eviction could occur as a result of the BTL development, most respondents do not believe they will receive fair compensation. When
15 See above n 17.
16 Office of The High Commissioner For Human Rights, (2012).
Eviction and Resettlement in Cambodia: Human Costs, Impacts and Solutions. Phnom Penh, p. 24. Retrieved from: http:// cambodia.ohchr.org/ sites/ default/ files/
Thematic-reports/ Resettlement_Study-28_Feb_2012_Eng.
17 See above n 6.pdf
18 Community meetings 2017 19 See above n 4.
20 Temporary occupation – families are granted permission from the land owner to reside on the land for free.
asked to respond to the statement “we are confident that we will receive fair compensation in the event of eviction”, 30 % disagreed, while 2 % strongly disagreed.
A large proportion (28 %) was indifferent, while only 16 % and 1 % agreed and strongly agreed. 23 % were unsure on the matter.
3.2.2.3 Change in Community Circumstance
Respondents of the communities’ household survey were asked to answer questions relating to their cir- cumstance, through choosing one of the following answers: ‘much better’, ‘better’, ‘same’, ‘worse’, and
‘much worse’, for each question asked. Various ques- tions were asked pertaining to their living condition, residency, and social circumstances.
a. Living conditions and residency
The household survey found that since infilling the lake, general living conditions for 45 % of respondents have remained the same. 29 % have reported improvements, and 27 % reported general living conditions had wors- ened.21 Similarly, 41 % of respondents reported their housing conditions had remained the same since infilling the lake, but 39 % have experienced a wors- ening. The worsening of living conditions and environ- ment could possibly be explained by the worsening of flooding in the communities with 44 %22 reporting that flooding has worsened since infilling the lake. Seven of the 11 communities present at the FGD said flooding was worse as a result of the lake infilling and poor sew- age systems. Prek Takong 1, for example, said floodwa- ter can reach depths of three meters during the rainy season. A resident from Deum Svay also added that the stagnant flood water becomes dirty and adversely affects residents’ health. Flooding also poses a drown- ing hazard for residents, especially children who have no formal swimming lessons.
Income opportunities have, for the most part, remained the same, with 61 % noticing little difference. How- ever, reports of decreased income opportunities (17 % worse and 5 % much worse), could be explained by those employed in the 2nd most common occupation, farming (14 %). The infilling of the lake has prevented the growing of aquatic crops by farmers in the area. In
21 Improvements combines better and much better, while worsened conditions include worse and much worse.
22 The combined total of those who responded ‘worse’
(31.4 %) and ‘much worse’ (12.6 %).
21 Chapter 3 – Findings
Khva, for example, residents have been suffering from reduced crop-growing capabilities. They explained to researchers that since the infilling of the lake began, the livelihoods of the community have significantly declined. Approximately 80 % of Khva’s residents made a living by growing the crop morning glory, but with the lake disappearing/ changing, they can no longer earn an income.23
Table 10: Summary of living conditions and residency change since development
Circumstance Most frequent
response 2nd most fre- quent response General living
condition Same (45,3 %) Better (25.7 %) Housing condition Same (41,0 %) Worse (28.2 %) Flooding Same (38,6 %) Worse (31.4 %) Income opportunity Same (61,4 %) Worse (17.2 %) Employment
opportunity Same (63,5 %) Worse (16.4 %) Food security Same (60,1 %) Worse (18.2 %) 23 Community meetings 2017
Regarding the living environment of each household within a community, respondents indicated the follow- ing as issues within their home:
Table 11: Issues with BTL homes
Issue Frequency % of Total
Bad smell 210 12,1
Broken objects 46 2,7
Dark 33 1,9
Flooding inside 120 6,9
Flooding outside 195 11,3
Mosquito presence 332 19,2
Other 3 0,2
Smokey 11 0,6
Too small 105 6,1
Trash piles 187 10,8
Unclean 190 11,0
Unsuitable bathroom 74 4,3
Unsuitable air circulation 145 8,4 Unsuitable cooking
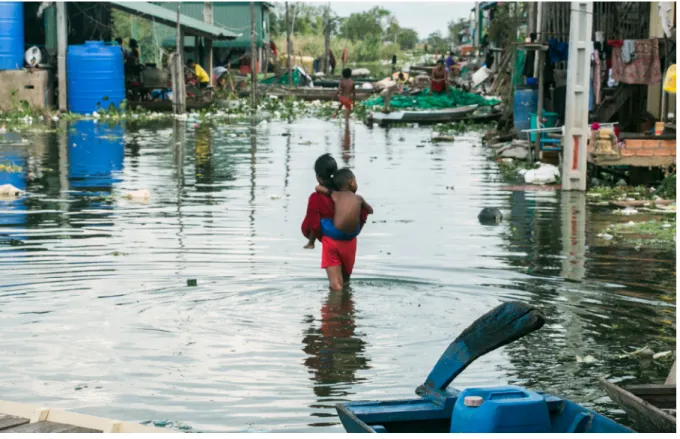
facilities/ eating places 23 1,3 Unsuitable sleeping condition 56 3,2 A child carriers a small boy on her back through flooded Preak Takong 1
22 Chapter 3 – Findings
The 3 most common problems regarding living con- ditions were noted as: 1) mosquito presence, 2) bad smells, and 3) flooding outside. It is most likely that the increase in polluted and stagnant water has facil- itated the increase in mosquito presence within the communities, meaning all three of the most common problems appear to arise from lack of infrastructure to cope with flooding.
The most problematic issue facing the community as a whole was recorded as flooding, with 29 % reporting flooding as the most problematic issue since develop- ers began infilling the lake.
b. Social circumstance
More positively, researchers found that since infill- ing the lake, relationships within communities have improved significantly. 41 % reported relationships with neighbours was better, while 5 % felt relationships were much better, making a total 47 % witnessing some level of improvement. 50 % felt there was no change, and only 3 % felt relationships had worsened.
In line with this, community cohesion has become enhanced, with 25 % noting improvements. Those feel- ing ‘there has been no change’ was the most common response, with 72 % feeling community cohesion had remained the same.
Perhaps due to better relationships, the increase in participation in community development can some- what be explained. 28 % believe participation has increased, but again, most (64 %) feel it is unchanged.
Looking at relationships beyond that with neighbours, many (43 %) Boeung Tompun residents felt that rela- tions with local authorities and NGOs are normal.24 39 % responded that their community has ‘good’ rela- tions with local authorities and the remaining 17 % believe relations are ‘not good’.
24 Neither noticeably ‘good’ nor ‘bad’.
3.2.2.4 Overall Situation and the Future
When asked to comment on the most severe impact on the community overall since infilling of the lake, the top three responses were: flooding (29 %), income (14 %), and threat of eviction (9 %).
Looking towards the future, 23 % of residents have said they plan to increase their security by upgrading their land title from soft to hard. 77 % of respondents, how- ever, have no plans regarding land tenure. Researchers uncovered several reasons from informal discussions with residents:
1. Land titles are too costly and take too long to obtain.
2. Residents have been told by local authorities they do not need hard land titles because development is occurring.
3. Residents do not understand the benefits of land titles.
4. Residents are unaware of how to apply for land titles – 88 % of people do not know who to con- tact, the documents required, or how to begin the application.
Plans for infrastructure vary, and are outlined in fig- ure 4 below:
Only 53 % of the 373 respondents gave any answer for future plans. 33 % gave the above answers, while 20 % answered ‘other’, with the top two ‘other’ responses being: build sewage system (3 %), and expand path/
road (2 %).
0.3
0 Construct bridge
Reach out to authorities for assistance Build sewage system
Construct street lights Upgrade/build new road
5 10 15 20 25 26
1.9 5.1 1.6
24.7
Future actions
Response frequency (%)
Figure 4: Communities’ plans for the future Table 12: Summary of social circumstance change since development
Circumstance Most frequent response 2nd most frequent response
Relationship with neighbours Same (50,1 %) Better (41,8 %)
Community cohesion Same (72,4 %) Better (21,4 %)
Participation in community development Same (63,8 %) Better (25,2 %)
23 Chapter 3 – Findings
3.2.3 Key Findings Summary
Of the six areas investigated for change in living con- dition, the second most frequent response (after ‘bet- ter’) was ‘worse’. The most problematic change in living conditions since development of the lake began was flooding, where 31 % and 12 % of respondents reported flooding had gotten ‘worse’ and ‘much worse’ respec- tively. 29 % also said flooding was the most problematic issue facing the community since infilling the lake.
3.3 Urban Development Master Plan
Given these findings, which outline the impact of devel- opment on BTL residents and the impact on the envi- ronment, it is fair to ask:
“Were these consequences of development discussed in the Urban Development Master Plan prior to develop- ment taking place in the Boeung Tompun area?”
The Urban Development Master Plan, ‘Phnom Penh Land Use for 2035’, is a long-term document blueprint-
ing Phnom Penh city’s development until 2035.25 The original document, which was 330 pages long, was funded by the French Embassy and officially adopted by the Cambodian cabinet in late 2015.26 The public version was translated into Khmer, and condensed from 330 pages to 35.27 There have been questions surrounding the plans implementation in the city, with accusations circulating that the plan may only exist
“merely for formality’s sake”.28
Nevertheless, it is important to determine how inclu- sive the master plan is in considering both human rights and environmental impacts. Without having access to the Urban Development Master Plan,29 it is difficult to discuss matters that pertain to it.
25 Cambodia Constructors Association (2016). Capital’s Urban Master Plan Adopted. [online] Construction and Property Magazines. Available at: http:// www.
construction-property.com/ read-more-337 26 Ibid.
27 Halim, H. (2016). Phnom Penh’s 2035 master plan in minimal use. The Phnom Penh Post. [online] Available at: http:// www.phnompenhpost.com/ post-property/
phnom-penhs-2035-master-plan-minimal-use 28 Ibid.
29 To see the masterplan requires submitting a formal per- mission request to the governor. The physical copy is out of bounds to press and only available to a select few. See above n 65.
24 Chapter 3 – Findings
Chapter 4 –
Conclusions and Recommendations
4.1 Conclusions
The benefits of Phnom Penh’s development and urban growth should not be understated. Creating opportu- nity for investment in business, expanding public roads and transport options, and increasing space for resi- dential development, will bring a wealth of benefits to the city, but these come at a cost.
Sacrificing the present situation for future gain is a globally debated topic, and varies in extremity on a case by case basis. The issue with the Boeung Tompun Lake development is the unnecessary suffering urban poor communities may be forced to endure. From this, and previous research, it appears that the main obstruction to reducing the present suffering in the face of development is a perceived lack of fair com- pensation.
Prior to possible eviction, residents also face daily struggles as the development of BTL imposes unde- sirable change on residents in the surrounding area.
Flooding, due to the infilling of the lake, is cited as the most problematic issue facing BTL communities. Fol- lowing this, a decline in income and threat of eviction are the top concerns for BTL residents. One resident from Preak Talong claimed the government “will not follow market prices on compensation”, and argued that “development will benefit powerful groups, while the community will get less”.
Residents are largely uninformed of development plans and exact boundaries, and in many cases are unaware of intentions to develop the land. In some instances, residents only discover these intentions when con- struction crews arrive onsite and begin development.
Additionally, the lack of an accountable central body, of which community grievances can be raised and addressed, is an issue – without access to information regarding the development of BTL in an easily digest- ible manner, residents are unaware of when, if at all, they might face eviction.
4.2 Recommendations
Development, urban planning, and the eviction and relocation of urban poor communities need to be practiced in a law abiding, just, and equitable man- ner so as to form the basis of long-term sustainable development.
The results from the communities’ questionnaire sug- gest the handling of the BTL development by authorities and development firms – and the subsequent impact on residents – leaves significant room for improvement.
It is from this that the following recommendations for key stakeholders have been suggested.
Local and National Authorities
1. Make intentions for future development plans clear to the public (or make the urban development mas- terplan more accessible), particularly to those who will be immediately affected as a result of residing within, or close to, the boundaries of development.
Awareness is critical for ensuring development is inclusive of all Phnom Penh citizens.
Non-Governmental Organizations and Civil Society Groups
1. NGOs need to continue bringing local and national issues, such as discussed in this report, to the pub- lic’s attention. In undertaking research and mak- ing the results available to the public they can give strong voices to communities that are currently experiencing difficulty with forced eviction or poor living conditions, and work towards finding solu- tions to such problems.
2. It is important for civil society and NGOs to dis- tribute legal advice to vulnerable and urban poor settlements subject to, or victims of, eviction and insecure land tenure.
3. Additionally, they should continue to assist com- munities with monitoring and recording any cases which violate their legal, housing and human rights, and provide support with raising such cases to the relevant authorities.
25 Chapter 4 – Conclusions and Recommendations
Urban Poor Communities
1. The most important recommendation for urban poor communities is to educate themselves on the current laws in place to ensure they are able to fairly fight for fair compensation. This also involves organizing legal documentation (e. g. fam- ily/ resident books, land titles (soft or hard), iden- tity cards). Other areas they should aim to become more knowledgeable in include: Circular No. 3, the Systematic Land Registration Process, and the avail- able avenues (even if they are ineffective) for lodg-
ing complaints. It is highly recommended that these communities seek the assistance of NGOs and char- ities to ensure the knowledge gained is accurate and complete.
2. Work to strengthen community cohesion, both within their own community and with others.
This can help to increase the flow of information between residents and communities, and it may act as a support network for those who are experienc- ing difficulties (such as reduced income opportuni- ties, or declines in living standards).
26 Chapter 4 – Conclusions and Recommendations
Annexes
1. Community Rep Survey
1. Community Rep Survey 1 Community Code_________________________________________________
2 Community Name
_________________________________________________
3 Number of occupied
households in community _________________________________________________
4 Number of families in
community _________________________________________________
5 Approximate number of
people in community Total: ___________________ Female: __________________
6 Community Representative
name and phone number _________________________________________________
7 Is this community on state, or
private land?
8 Community Size (m2) _________________________________________________
9 What year did the community
first settle? _________________________________________________
10 Is the community organised? a. Yes (what year
_______) b. No
11
Current eviction status /
threat level a. No known threat
b. Informal rumours of Eviction
c. Formal notice of eviction
d. Already evicted (please specify year eviction occurred) _________
e.
Don’t Know
f. Other (please specify)
27 Annexes
1
2. Initial community discussion questions 1. Community / Meeting info.
Date & Time of meeting: dd/mm/yyy Researcher(s) present at meeting: Name
Number of different households present at meeting: # Number of people present at meeting: # (f=#)
2. Introduce why researchers are visiting them.
3. Show them a photo of the intended development plan.
4. Discussion points for meeting 1. Development
a. General opinion of development in Phnom Penh 2. Knowledge
a. Current knowledge of development in Boeung Tompun
b. How much have you been told about development in BT and who by?
c. Have local authorities contacted you?
3. Feelings and Opinions
a. How does the development in BT make you feel?
4. Circumstances
a. Since infilling the lake, how has your employment / income been affected?
b. Have your living conditions changed?
5. Community Action
a. Have you participated in any community action, for example, protests?
b. Did you experience any violence or fear?
6. Plan for future
a. Have you thought about a plan in the event of eviction?
2. Initial community discussion questions
28 Annexes