Methods and instruments for the evaluation and monitoring of VET systems
Monitoring of Qualification and Employment in Austria – an empirical approach based on the labour force survey
(LFS)
1Lorenz Lassnigg, Stefan Vogtenhuber Institute for Advanced Studies (IHS), Vienna
Stumpergasse 56, A-1060 Vienna
Summary: The purpose of the study is to make use of the information about ISCED-study-fields available with the LFS since 2004 for a monitoring of the relationship of initial VET to employment in Austria.
First a meaningful classification of VET supply (upper and post- secondary ET, higher education) has been constructed; second a set of indicators has been developed and explored using available data.
The indicators include three sections (a. demography and gender; b.
employment, unemployment and income; c. competences, occupations and trades). The monitoring should produce signals about risks and opportunities across the ET-supply spectrum, comparing the empirical results for the various programmes. The results are not meant to produce „hard evidence“, but rather empirical indications which should draw attention to certain areas of risk, in order to decide about further inquiries. The theoretical approach is
“constructivist”: the results should provide an input into a social system of knowledge production among the various stakeholders to create common reflection about the empirical relationship between supply and demand.
Keywords: monitoring, indicators, VET, knowledge production
Introduction
An attempt for the development of a monitoring system of the relationship between initial VET and employment in Austria is reported, using new Labour Force Survey- (LFS)-data. The background is a strong initial vocational education and training- (VET) system, which has to – in one way or another – govern its relationship to employment (e.g., by setting decisions about the structure of qualifications, or about the financial inputs and the regional distribution of ET institutions, etc.) The rationale of the monitoring system is not a narrow technical concept of skills demand or matching, but an open conception of the VET-employment relationship which is influenced by several factors from the demand and the supply side.
Currently the very complex structures of governance of the Austrian VET system are based mainly on informal flows of information that are held by the various
stakeholders, but are not formally documented. Some formal exercises of forecasting labour demand are mostly not related to the supply side. The data about the labour
1 Draft-Paper presented at the Workshop organized by BIBB about “Methods and instruments for the evaluation and monitoring of VET systems”, 10 and 11 December 2009, Bonn.
market development do not include information about the VET specialisations, which has been available in the past only every ten years with the population census
(Lassnigg 2006, 2004a).
More recently, a new variable about the ISCED fields of study has been included in the European LFS. These data are explored in our study as a potential basis for the development of a regular monitoring system that can provide information about the empirical relationship between initial VET and employment. We contend that this empirical information, if it is provided on a regular basis, can contribute to a more evidence-based decision making in the governance system of VET and higher education (HE). Currently the system is to some degree driven by informal and localised knowledge held by the various stakeholders and groups or networks of stakeholders in the system, and ultimately the market is correcting the decisions based on this informal knowledge about the ET supply. If formal information about the use of qualifications is lacking, several kinds of myopia or distorted perception might arise: E.g., strong and powerful suppliers might be interested to “market” their supply; on the demand side there might be an interest to create an oversupply that can beat down the wages; new demands might not be visible because of a lack of related powerful stakeholders, etc.
Targeted Problem
The problem targeted by the project has been threefold: (1) the lack of regular and timely information about the relation of initial ET and employment; (2) the lack of a usable an comprehensive classification of the specialisations of the initial VET system; (3) the creation of regular information flows that might infuse the provided information into the governance system of initial ET.
Lack of information
Initial VET is a strong and specialised system in Austria, with its main domain at the upper secondary level. About 85% of the 20-24-years age cohort, and about 80%
of the 25-64-years population have attained an upper secondary qualification (NBB I, D5, D8), most of them a VET qualification. The supply of initial ET is still strongly differentiated and specialised, with more than 500 specialisations in two sectors (full time schools with upper and lower level, and apprenticeship) at upper secondary level
2and even more programmes in higher education.
3Of course, many of these programmes are attended by few students only; nevertheless, infrastructure and personnel must be provided and planned including decision about scarce resources.
Employment prospects should be at least be taken into account in these decision, what, however, is not possible if even simple information about the employment of graduates or completers of the programmes is not available.
Lack of a classification of ET supply
A first step to develop regular information about employment is the construction of a classification that is able to describe the differentiated supply in a meaningful way.
Such a kind of classification does not exist so far; rather there are lists of
programmes in different orders, mostly based on institutional categories. The lack of
2 We find about 50 school types with about 300 specialisations in VET full-time schools and about 250 apprenticeship occupations (see http://www.abc.berufsbildendeschulen.at/de/news.asp).
3 Almost 500 programmes are documented at the polytechnics or universities of applied science (http://www.fachhochschulen.ac.at/de/studienangebot), and the programmes at universities also
a shared classification means that no language exists among the stakeholders to even communicate the overall structure of the system.
Moreover, taking into account the high number of specialisations, it is not possible to create an overview at this level of differentiation. As a first task, a classification has been created which should be usable by the stakeholders. Therefore a classification has been developed stepwise through a series of workshops including experts from the supply and demand side, from the public employment service, from statistics, and from research and development (R&D). The result of this procedure was a
classification of 44 programme categories spanning the overall spectrum of ET supply from compulsory education to higher education.
The ISCED study fields were used as a reference, and the classification strategy was to identify major programmes
4in terms of size by specific categories, and to merge the smaller programmes to meaningful categories due to level and field (Lassnigg & Vogtenhuber 2007, 46-47).
Creation of regular information flows to initiate knowledge management/production among stakeholders
Based on the experience, that R&D-based forecasts and analyses have not been recognized – not to mention used – in the past a basic idea of the study has been to create a non-technical descriptive tool for a regular monitoring of the relation of ET- supply and employment. The stakeholders involved in the development of the classification should also be regularly informed about the new monitoring results.
Because of the institutional fragmentation of the system to different sectors (full- time schools and colleges, apprenticeship, polytechnics, and universities) and to different groupings of specialisations within the different sectors (engineering,
business, social work, health, agriculture, production, services, etc.) the stakeholders are considering only their sector/specialisation, without looking at the overall
development. To overcome this fragmentation the project has taken a comparative view, showing at set of indicators for the different specialisations.
Moreover, in order to initiate knowledge management and knowledge production among stakeholders, the system was not designed to produce ready truths but rather indications that should be combined with the informal knowledge in the various
sectors/specialisations, and produce questions for further consideration and analysis.
Thus a kind of language and common ground should be developed, to create awareness about what goes on empirically, as basis for reflection about the goals and objectives of programmes and their practical implementation (Lassnigg 2004b)
Methodology
The methodology used is rather simple, by creating a multi-faceted set of detailed indicators, and summary indexes to provide a comparative overview across the classification of initial ET supply. The agreed classification of ET supply includes 44 categories at the different levels according to the structure of the Austrian system (17 apprenticeship categories including „masters“; 7 lower level secondary VET schools;
6 upper level secondary VET colleges; 2 post secondary categories; 10 higher education categories combining polytechnics and universities; 2 categories without specialisation: compulsory school and upper level academic school).
4 About 50 programmes were attended by at least 1.000 students in the reference year (2002/03); this shows the strongly skewed distribution of the supply; the distribution also shows that the specialization is much higher in traditional production fields and in engineering than in service oriented programmes.
The development of indicators was constrained by severe data problems, as the Austrian LFS does not allow the disaggregation of yearly cohorts by age-years and sex because of too small sample size. We are confronted with the problem that the main European and Austrian data source about employment and the labour market still does not allow a simple descriptive follow-up of the transition from school to work of young people for statistical reasons. Therefore we created a set of more indirect indicators that include three sections based on the pooled LSF 2004-06:
- Demography: age, migration, gender; 11 indicators
- Employment: employment rates, unemployment, income; 9 indicators - Utilisation: competences, occupations, trades; 5 (condensed) indicators
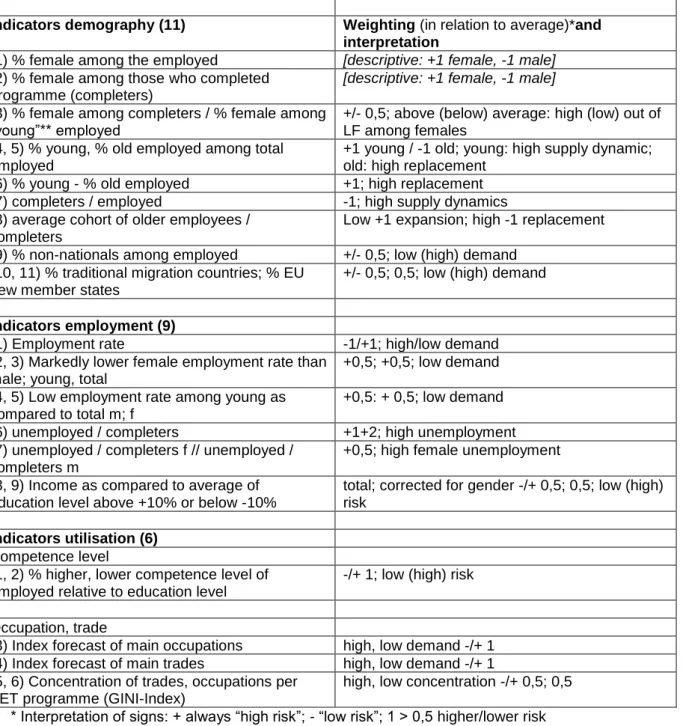
Figure 1: Indicators
Indicators demography (11) Weighting (in relation to average)*and interpretation
(1) % female among the employed [descriptive: +1 female, -1 male]
(2) % female among those who completed programme (completers)
[descriptive: +1 female, -1 male]
(3) % female among completers / % female among
“young”** employed +/- 0,5; above (below) average: high (low) out of LF among females
(4, 5) % young, % old employed among total employed
+1 young / -1 old; young: high supply dynamic;
old: high replacement (6) % young - % old employed +1; high replacement (7) completers / employed -1; high supply dynamics (8) average cohort of older employees /
completers
Low +1 expansion; high -1 replacement (9) % non-nationals among employed +/- 0,5; low (high) demand
(10, 11) % traditional migration countries; % EU new member states
+/- 0,5; 0,5; low (high) demand
Indicators employment (9)
(1) Employment rate -1/+1; high/low demand
(2, 3) Markedly lower female employment rate than male; young, total
+0,5; +0,5; low demand (4, 5) Low employment rate among young as
compared to total m; f
+0,5: + 0,5; low demand (6) unemployed / completers +1+2; high unemployment (7) unemployed / completers f // unemployed /
completers m
+0,5; high female unemployment (8, 9) Income as compared to average of
education level above +10% or below -10%
total; corrected for gender -/+ 0,5; 0,5; low (high) risk
Indicators utilisation (6) Competence level
(1, 2) % higher, lower competence level of employed relative to education level
-/+ 1; low (high) risk
Occupation, trade
(3) Index forecast of main occupations high, low demand -/+ 1 (4) Index forecast of main trades high, low demand -/+ 1 (5, 6) Concentration of trades, occupations per
VET programme (GINI-Index)
high, low concentration -/+ 0,5; 0,5
* Interpretation of signs: + always “high risk”; - “low risk”; 1 > 0,5 higher/lower risk
** “young” were defined differently according to upper secondary and higher education levels
The demography indicators reflect firstly the descriptive aspect of segregation of programmes by gender, which is quite high in the Austrian system. Second the relationship of young and old employees indicates potential replacement demand or a high current additional supply of young completers. Third, an increased
employment of non-nationals as compared to the average is seen as an indicator for high demand, as the employment of non-nationals is handled rather restrictive.
The employment indicators include firstly overall and gender specific employment and unemployment figures, and unemployment related to completers. The relative income as compared to the average of the ET level is also taken as an indicator for demand.
Finally some more complex indicators should reflect current and future utilisation of qualifications. First, the relative competence level of employees should reflect higher/lower demand, second forecasting figures are used, and thirdly the
concentration of occupations/trades per ET programme should also reflect demand.
The procedure includes the following steps
(1) the calculation of the 25 indicators, and sorting of ET-programmes for each from maximum to minimum;
(2) graphical representation of each indicator: upward right increasing risk, downward left increasing opportunities;
5(3) inspection of each figure and definition of the section indicators by setting the cutting points: assignment of (+) and (-) to categories above/below the cutting point with 0,5, 1 or sometimes 2, according to the weight for risks/opportunities; inspecting the empirical distributions, at the point where discontinuities are occurring, the cutting points are set.
(4) summing up per section, and totally for the composite indicator.
Results and Perspectives for further development
For the described instrument/approach as such
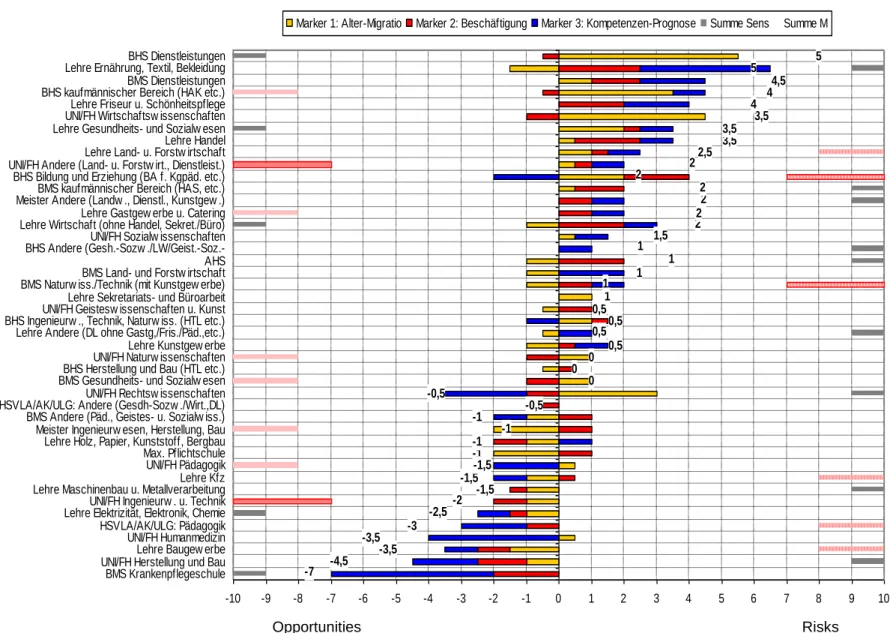
The results allow for a comparison of the 44 categories of VET programmes first by the composite indicator. The composite indicator varies between +5 and –7, with two thirds of the categories between +/-2. Nine categories are indicated with
increased risk, and six categories with increased opportunities (figure 2, 3).
Increased risk results to some degree from demography, in particular in the expanding upper level programmes. In the more traditional programmes rather utilisation gives the strongest contribution. On the side of reduced risks rather utilisation indicators play the strongest role, followed by demography.
Concerning the levels of programmes there is no clear picture of upper or lower levels, both increased and reduced risk programmes are mixed. There are three big programmes in each of the risk categories, female programmes are over represented among the increased risk programmes and male programmes are even more over represented in the reduced risk programmes.
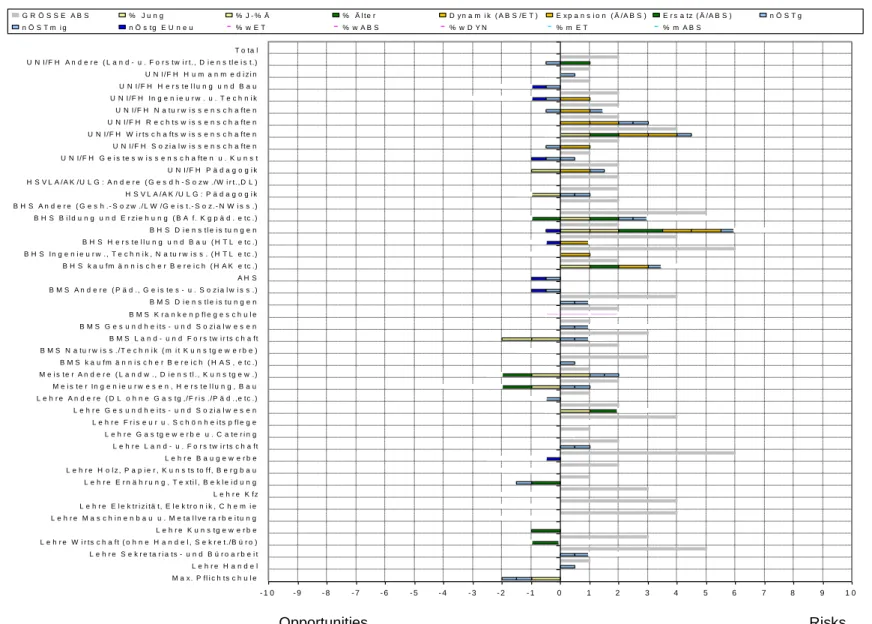
A second step allows for an inspection of the different sections from where the risks/opportunities are resulting (Figure APP2-4). Figure APP2 shows the
demographic indicators. There are five programmes, which show a very strong demographic dynamic. All of them are situated at the upper level of higher education or VET colleges. Only few programmes show high indications of replacement, mainly in the apprenticeship sector including the masters (Meister). The demographic
5 The results of this procedure can be found in the internet: [http://www.equi.at/material/indicators- monitoring.pdf]
structure also shows that almost one third of the programme categories are strongly biased by gender (6 male, 6 female).
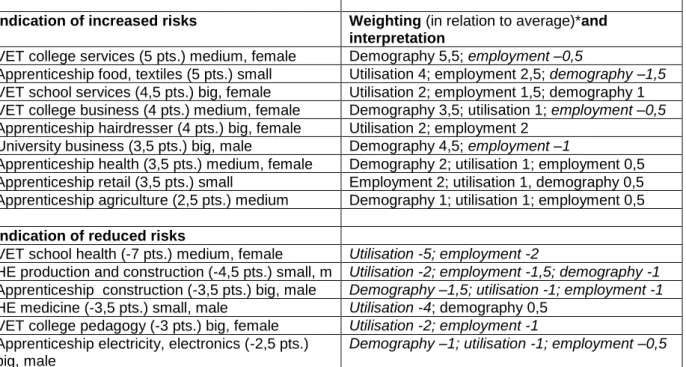
Figure 2: Results composite indicator and contribution of sections
Indication of increased risks Weighting (in relation to average)*and interpretation
VET college services (5 pts.) medium, female Demography 5,5; employment –0,5
Apprenticeship food, textiles (5 pts.) small Utilisation 4; employment 2,5; demography –1,5 VET school services (4,5 pts.) big, female Utilisation 2; employment 1,5; demography 1 VET college business (4 pts.) medium, female Demography 3,5; utilisation 1; employment –0,5 Apprenticeship hairdresser (4 pts.) big, female Utilisation 2; employment 2
University business (3,5 pts.) big, male Demography 4,5; employment –1
Apprenticeship health (3,5 pts.) medium, female Demography 2; utilisation 1; employment 0,5 Apprenticeship retail (3,5 pts.) small Employment 2; utilisation 1, demography 0,5 Apprenticeship agriculture (2,5 pts.) medium Demography 1; utilisation 1; employment 0,5 Indication of reduced risks
VET school health (-7 pts.) medium, female Utilisation -5; employment -2
HE production and construction (-4,5 pts.) small, m Utilisation -2; employment -1,5; demography -1 Apprenticeship construction (-3,5 pts.) big, male Demography –1,5; utilisation -1; employment -1 HE medicine (-3,5 pts.) small, male Utilisation -4; demography 0,5
VET college pedagogy (-3 pts.) big, female Utilisation -2; employment -1 Apprenticeship electricity, electronics (-2,5 pts.)
big, male
Demography –1; utilisation -1; employment –0,5
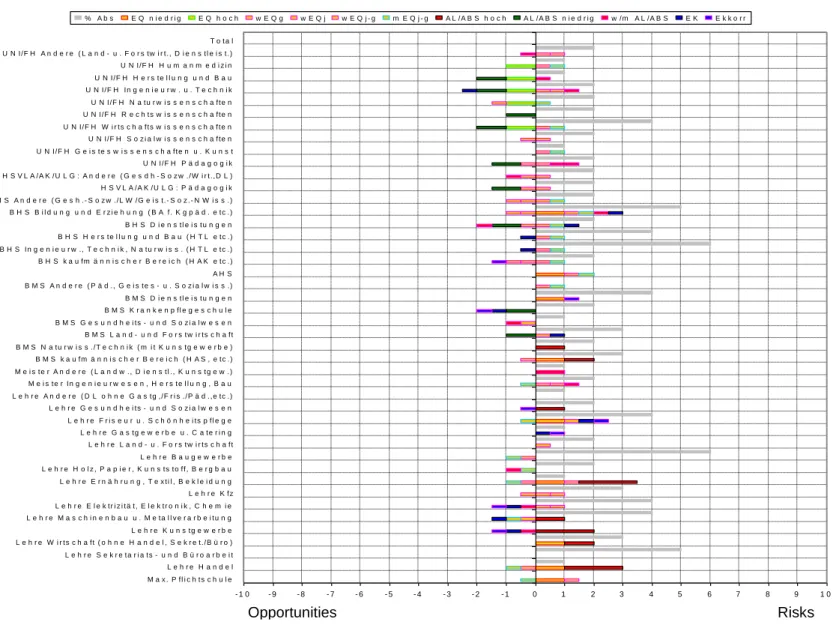
The employment related indicators (Figure APP3) show positive indications (high employment rates, low unemployment related to the completers) in some of the higher education programmes, and negative indications are present rather in the apprenticeship sector (high unemployment and low employment rates).
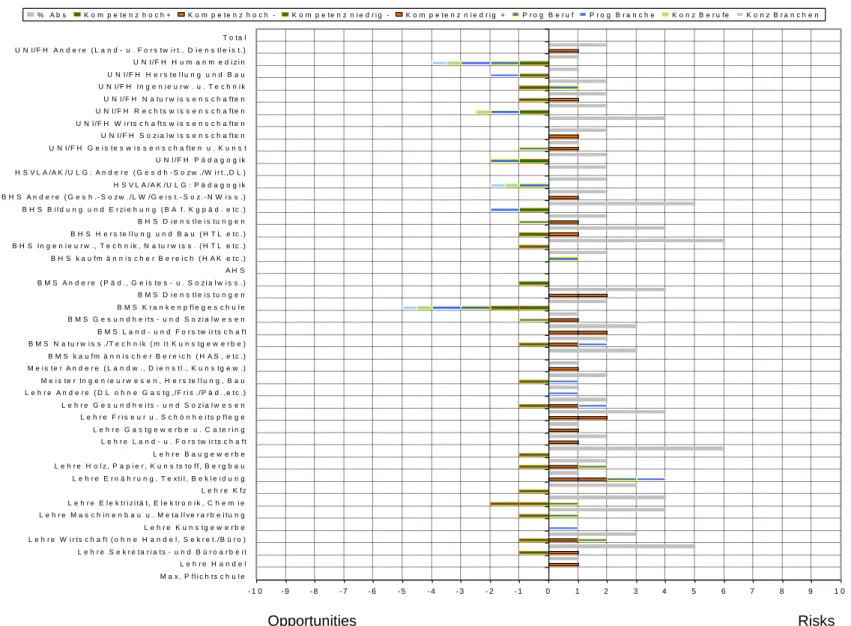
Figure APP4 shows the utilisation indicators. Few programmes have strong positive indications from the forecasts and also from the utilisation of qualifications.
The latter is distributed in a rather mixed manner across the spectrum of programmes.
Summarizing the results for the individual programmes we can firstly look at the programmes with increased risk. Six to eight of the 44 programmes show indications for increased risks, originating in different dimensions:
- high supply dynamics, without visible demand: VET colleges in services and business, and higher education business programmes;
- bad employment and bad forecasts: apprenticeship food and textiles and apprenticeship hairdresser;
- each of the three sections not favourable: VET school services, apprenticeship health and retail.
Those programmes are rather low level qualifications and rather big programmes For four to five of 44 VET programmes good opportunities are indicated, coming from the competences and the forecasts, and partly from employment – the supply dynamic is rather low:
- two programmes with good competence and forecast indications are in the health services (higher education medicine and VET colleges health)
- mixed positive indications show two programmes in construction (higher education and apprenticeship) and the postsecondary pedagogy programmes.
Those programmes are at higher or medium level and small or medium size
The remaining 31 to 34 programmes show moderate values, some are slightly biased to risks (ca. seven programmes) or to opportunities (ca. nine programmes).
Law studies show a polarised structure of high supply dynamics and good values at employment and utilisation. Thirteen programmes don’t show a deviation from average, supply dynamic is often low, employment and utilisation is rather unfavourable
Potential weaknesses of the methodology applied might be seen in its simplicity.
One is the “handmade” setting of the cutting points. We can check for this by looking whether some programmes are often neighbouring the cutting point, so that they would shift into the risk/opportunity category if the cutting point were slightly different.
If we check this we can see that the maximum at which some categories are neighbouring the cutting point are three times out of 25 indicators (4 programmes, none of them in the risk or opportunity group), 10 programmes are neighbouring the cutting point for two times and 14 programmes one time. Altogether 28 out of 44 programmes fail this sensitivity test; that is more than half of the programmes (see figure APP1 where the bars at the left and right edges indicate the number of neighbouring indicators at the risk-right or the opportunity-left side). Figure 3 shows that the sensitivity marker is uncorrelated with the composite indicator.
Figure 3: Scatter of the rank of programmes on the composite indicator with sensitivity
More sensitivity analyses should be done for the control of the composition of the indicators, e.g., by taking a technical cutting point (the x highest/lowest values), and comparing the results.
Another step of validation, which could be particularly interesting if comparisons by country are made, might be modelling the composition of the composite indicator by its components.
As for this first run of the study only the LFS 2004-06 was available, we can also follow-up the development.
6Potentials and challenges for the use in/for international comparisons
6 This will be done for the final paper, and maybe already for the presentation at the Bonn-workshop.
R2 = 0,001
-4 -3 -2 -1 0 1 2 3 4
-8 -6 -4 -2 0 2 4 6
Summenmarker
Sensitivität
Composite Indicator S
e n s i t i v i t y
In principle the methodology can be used for international comparisons, as the data of the LFS are available for the EU member states. A main challenge will be the differing structures of VET systems between countries. Two versions could be
envisaged: one that takes the differing structures as point of departure, and analyses the components of the risks and opportunities; another that constructs a kind of standard structure of ET programmes at a similar level of specialisation.
References
Lassnigg, L. & Vogtenhuber, S. 2007. Klassifikation für Ausbildung und Beruf: Darstellung der Klassifikation. IHS-research report. Vienna [Internet: http://www.equi.at/dateien/IHS-
Ausbildungsklassifikatio.pdf; 2009-11-23].
Lassnigg, L. 2004a. To match or mismatch? The Austrian VET system on struggle with diverse and changing demand. Berufs- und Wirtschaftspaedagogik - online Nr.7 [Internet:
http://www.bwpat.de/7eu/lassnigg_at_bwpat7.pdf; 2009-11-23].
Lassnigg, L. 2004b. Indicators for Quality in VET. European Experience. IHS Sociological series Nr.63 [Internet: http://www.ihs.ac.at/publications/soc/rs63.pdf; 2009-11-23].
Lassnigg, L. 2006. Approaches for the anticipation of skill needs in the "Transitional Labour Market"
perspective - the Austrian experience. WZB Discussion paper SP I 2006-105 [Internet: http://skylla.wz- berlin.de/pdf/2006/i06-105.pdf].
NBB-Nationaler Bildungsbericht Österreich 2009. Vol.I: Das Schulsystem im Spiegel von Daten und Indikatoren. Graz: Leykam [Internet: http://www.bifie.at/buch/657/1/d; 2009-11-23]
Figure APP1: Composite indicator Summenmarker
-4,5 -3,5-3,5 -3
-1,5 -1,5
-1 -1
-1 -0,5
-0,5
0 0 0 0,5
0,50,5 1
1
3,5 3,5 43,544,5
5
2
1,5
-2,5 -2
-7
-1,5 -1
0,5 1
1 1
22 2 2 2
2,5 5
-10 -9 -8 -7 -6 -5 -4 -3 -2 -1 0 1 2 3 4 5 6 7 8 9 10
BMS Krankenpflegeschule UNI/FH Herstellung und Bau Lehre Baugew erbe UNI/FH Humanmedizin HSVLA/AK/ULG: Pädagogik Lehre Elektrizität, Elektronik, ChemieUNI/FH Ingenieurw . u. Technik Lehre Maschinenbau u. MetallverarbeitungMeister Ingenieurw esen, Herstellung, BauLehre Holz, Papier, Kunststoff, BergbauMax. PflichtschuleUNI/FH PädagogikLehre Kfz BMS Andere (Päd., Geistes- u. Sozialw iss.) HSVLA/AK/ULG: Andere (Gesdh-Sozw ./Wirt.,DL)UNI/FH Rechtsw issenschaften BMS Gesundheits- und Sozialw esenBHS Herstellung und Bau (HTL etc.)UNI/FH Naturw issenschaftenLehre Kunstgew erbe Lehre Andere (DL ohne Gastg,/Fris./Päd.,etc.) BHS Ingenieurw ., Technik, Naturw iss. (HTL etc.)UNI/FH Geistesw issenschaften u. KunstLehre Sekretariats- und Büroarbeit BMS Naturw iss./Technik (mit Kunstgew erbe)BMS Land- und Forstw irtschaftAHS BHS Andere (Gesh.-Sozw ./LW/Geist.-Soz.-UNI/FH Sozialw issenschaften Lehre Wirtschaft (ohne Handel, Sekret./Büro)Lehre Gastgew erbe u. Catering Meister Andere (Landw ., Dienstl., Kunstgew .)BMS kaufmännischer Bereich (HAS, etc.) BHS Bildung und Erziehung (BA f. Kgpäd. etc.) UNI/FH Andere (Land- u. Forstw irt., Dienstleist.) Lehre Land- u. Forstw irtschaftLehre Handel Lehre Gesundheits- und Sozialw esenUNI/FH Wirtschaftsw issenschaftenLehre Friseur u. Schönheitspflege BHS kaufmännischer Bereich (HAK etc.)BMS Dienstleistungen Lehre Ernährung, Textil, BekleidungBHS Dienstleistungen
Marker 1: Alter-Migratio Marker 2: Beschäftigung Marker 3: Kompetenzen-Prognose Summe Sens Summe M
Opportunities Risks
Figure APP2: Section indicator demography
M a r k e r 1 : D e m o g r a f i e
- 1 0 - 9 - 8 - 7 - 6 - 5 - 4 - 3 - 2 - 1 0 1 2 3 4 5 6 7 8 9 1 0
M a x . P f l i c h t s c h u l e L e h r e H a n d e l L e h r e S e k r e t a r i a t s - u n d B ü r o a r b e i t L e h r e W i r t s c h a f t ( o h n e H a n d e l , S e k r e t . / B ü r o ) L e h r e K u n s t g e w e r b e L e h r e M a s c h i n e n b a u u . M e t a l l v e r a r b e i t u n g L e h r e E l e k t r i z i t ä t , E l e k t r o n i k , C h e m i e L e h r e K f z L e h r e E r n ä h r u n g , T e x t i l , B e k l e i d u n g L e h r e H o l z , P a p i e r , K u n s t s t o f f , B e r g b a u L e h r e B a u g e w e r b e L e h r e L a n d - u . F o r s t w i r t s c h a f t L e h r e G a s t g e w e r b e u . C a t e r i n g L e h r e F r i s e u r u . S c h ö n h e i t s p f l e g e L e h r e G e s u n d h e i t s - u n d S o z i a l w e s e n L e h r e A n d e r e ( D L o h n e G a s t g , / F r i s . / P ä d . , e t c . ) M e i s t e r I n g e n i e u r w e s e n , H e r s t e l l u n g , B a u M e i s t e r A n d e r e ( L a n d w . , D i e n s t l . , K u n s t g e w . ) B M S k a u f m ä n n i s c h e r B e r e i c h ( H A S , e t c . ) B M S N a t u r w i s s . / T e c h n i k ( m i t K u n s t g e w e r b e ) B M S L a n d - u n d F o r s t w i r t s c h a f t B M S G e s u n d h e i t s - u n d S o z i a l w e s e n B M S K r a n k e n p f l e g e s c h u l e B M S D i e n s t l e i s t u n g e n B M S A n d e r e ( P ä d . , G e i s t e s - u . S o z i a l w i s s . ) A H S B H S k a u f m ä n n i s c h e r B e r e i c h ( H A K e t c . ) B H S I n g e n i e u r w . , T e c h n i k , N a t u r w i s s . ( H T L e t c . ) B H S H e r s t e l l u n g u n d B a u ( H T L e t c . ) B H S D i e n s t l e i s t u n g e n B H S B i l d u n g u n d E r z i e h u n g ( B A f . K g p ä d . e t c . ) B H S A n d e r e ( G e s h . - S o z w . / L W / G e i s t . - S o z . - N W i s s . ) H S V L A / A K / U L G : P ä d a g o g i k H S V L A / A K / U L G : A n d e r e ( G e s d h - S o z w . / W i r t . , D L ) U N I / F H P ä d a g o g i k U N I / F H G e i s t e s w i s s e n s c h a f t e n u . K u n s t U N I / F H S o z i a l w i s s e n s c h a f t e n U N I / F H W i r t s c h a f t s w i s s e n s c h a f t e n U N I / F H R e c h t s w i s s e n s c h a f t e n U N I / F H N a t u r w i s s e n s c h a f t e n U N I / F H I n g e n i e u r w . u . T e c h n i k U N I / F H H e r s t e l l u n g u n d B a u U N I / F H H u m a n m e d i z i n U N I / F H A n d e r e ( L a n d - u . F o r s t w i r t . , D i e n s t l e i s t . ) T o t a l
G R Ö S S E A B S % J u n g % J - % Ä % Ä l t e r D y n a m i k ( A B S / E T ) E x p a n s i o n ( Ä / A B S ) E r s a t z ( Ä / A B S ) n Ö S T g
n Ö S T m i g n Ö s t g E U n e u % w E T % w A B S % w D Y N % m E T % m A B S
Figure APP3: Section indicator employment M a r k e r 2 : B e s c h ä f t i g u n g
- 1 0 - 9 - 8 - 7 - 6 - 5 - 4 - 3 - 2 - 1 0 1 2 3 4 5 6 7 8 9 1 0
M a x . P f l i c h t s c h u l e L e h r e H a n d e l L e h r e S e k r e t a r i a t s - u n d B ü r o a r b e i t L e h r e W i r t s c h a f t ( o h n e H a n d e l , S e k r e t . / B ü r o ) L e h r e K u n s t g e w e r b e L e h r e M a s c h i n e n b a u u . M e t a l l v e r a r b e i t u n g L e h r e E l e k t r i z i t ä t , E l e k t r o n i k , C h e m i e L e h r e K f z L e h r e E r n ä h r u n g , T e x t i l , B e k l e i d u n g L e h r e H o l z , P a p i e r , K u n s t s t o f f , B e r g b a u L e h r e B a u g e w e r b e L e h r e L a n d - u . F o r s t w i r t s c h a f t L e h r e G a s t g e w e r b e u . C a t e r i n g L e h r e F r i s e u r u . S c h ö n h e i t s p f l e g e L e h r e G e s u n d h e i t s - u n d S o z i a l w e s e n L e h r e A n d e r e ( D L o h n e G a s t g , / F r i s . / P ä d . , e t c . ) M e i s t e r I n g e n i e u r w e s e n , H e r s t e l l u n g , B a u M e i s t e r A n d e r e ( L a n d w . , D i e n s t l . , K u n s t g e w . ) B M S k a u f m ä n n i s c h e r B e r e i c h ( H A S , e t c . ) B M S N a t u r w i s s . / T e c h n i k ( m i t K u n s t g e w e r b e ) B M S L a n d - u n d F o r s t w i r t s c h a f t B M S G e s u n d h e i t s - u n d S o z i a l w e s e n B M S K r a n k e n p f l e g e s c h u l e B M S D i e n s t l e i s t u n g e n B M S A n d e r e ( P ä d . , G e i s t e s - u . S o z i a l w i s s . ) A H S B H S k a u f m ä n n i s c h e r B e r e i c h ( H A K e t c . ) B H S I n g e n i e u r w . , T e c h n i k , N a t u r w i s s . ( H T L e t c . ) B H S H e r s t e l l u n g u n d B a u ( H T L e t c . ) B H S D i e n s t l e i s t u n g e n B H S B i l d u n g u n d E r z i e h u n g ( B A f . K g p ä d . e t c . ) B H S A n d e r e ( G e s h . - S o z w . / L W / G e i s t . - S o z . - N W i s s . ) H S V L A / A K / U L G : P ä d a g o g i k H S V L A / A K / U L G : A n d e r e ( G e s d h - S o z w . / W i r t . , D L ) U N I / F H P ä d a g o g i k U N I / F H G e i s t e s w i s s e n s c h a f t e n u . K u n s t U N I / F H S o z i a l w i s s e n s c h a f t e n U N I / F H W i r t s c h a f t s w i s s e n s c h a f t e n U N I / F H R e c h t s w i s s e n s c h a f t e n U N I / F H N a t u r w i s s e n s c h a f t e n U N I / F H I n g e n i e u r w . u . T e c h n i k U N I / F H H e r s t e l l u n g u n d B a u U N I / F H H u m a n m e d i z i n U N I / F H A n d e r e ( L a n d - u . F o r s t w i r t . , D i e n s t l e i s t . ) T o t a l
% A b s E Q n i e d r i g E Q h o c h w E Q g w E Q j w E Q j - g m E Q j - g A L / A B S h o c h A L / A B S n i e d r i g w / m A L / A B S E K E k k o r r
Opportunities Risks
Figure APP4: Section indicator utilisation
M a r k e r 3 : K o m p e t e n z e n , B e r u f e , W i r t s c h a f t s k l a s s e n
- 1 0 - 9 - 8 - 7 - 6 - 5 - 4 - 3 - 2 - 1 0 1 2 3 4 5 6 7 8 9 1 0
M a x . P f l i c h t s c h u l e L e h r e H a n d e l L e h r e S e k r e t a r i a t s - u n d B ü r o a r b e i t L e h r e W i r t s c h a f t ( o h n e H a n d e l , S e k r e t . / B ü r o ) L e h r e K u n s t g e w e r b e L e h r e M a s c h i n e n b a u u . M e t a l l v e r a r b e i t u n g L e h r e E l e k t r i z i t ä t , E l e k t r o n i k , C h e m i e L e h r e K f z L e h r e E r n ä h r u n g , T e x t i l , B e k l e i d u n g L e h r e H o l z , P a p i e r , K u n s t s t o f f , B e r g b a u L e h r e B a u g e w e r b e L e h r e L a n d - u . F o r s t w i r t s c h a f t L e h r e G a s t g e w e r b e u . C a t e r i n g L e h r e F r i s e u r u . S c h ö n h e i t s p f l e g e L e h r e G e s u n d h e i t s - u n d S o z i a l w e s e n L e h r e A n d e r e ( D L o h n e G a s t g , / F r i s . / P ä d . , e t c . ) M e i s t e r I n g e n i e u r w e s e n , H e r s t e l l u n g , B a u M e i s t e r A n d e r e ( L a n d w . , D i e n s t l . , K u n s t g e w . ) B M S k a u f m ä n n i s c h e r B e r e i c h ( H A S , e t c . ) B M S N a t u r w i s s . / T e c h n i k ( m i t K u n s t g e w e r b e ) B M S L a n d - u n d F o r s t w i r t s c h a f t B M S G e s u n d h e i t s - u n d S o z i a l w e s e n B M S K r a n k e n p f l e g e s c h u l e B M S D i e n s t l e i s t u n g e n B M S A n d e r e ( P ä d . , G e i s t e s - u . S o z i a l w i s s . ) A H S B H S k a u f m ä n n i s c h e r B e r e i c h ( H A K e t c . ) B H S I n g e n i e u r w . , T e c h n i k , N a t u r w i s s . ( H T L e t c . ) B H S H e r s t e l l u n g u n d B a u ( H T L e t c . ) B H S D i e n s t l e i s t u n g e n B H S B i l d u n g u n d E r z i e h u n g ( B A f . K g p ä d . e t c . ) B H S A n d e r e ( G e s h . - S o z w . / L W / G e i s t . - S o z . - N W i s s . ) H S V L A / A K / U L G : P ä d a g o g i k H S V L A / A K / U L G : A n d e r e ( G e s d h - S o z w . / W i r t . , D L ) U N I / F H P ä d a g o g i k U N I / F H G e i s t e s w i s s e n s c h a f t e n u . K u n s t U N I / F H S o z i a l w i s s e n s c h a f t e n U N I / F H W i r t s c h a f t s w i s s e n s c h a f t e n U N I / F H R e c h t s w i s s e n s c h a f t e n U N I / F H N a t u r w i s s e n s c h a f t e n U N I / F H I n g e n i e u r w . u . T e c h n i k U N I / F H H e r s t e l l u n g u n d B a u U N I / F H H u m a n m e d i z i n U N I / F H A n d e r e ( L a n d - u . F o r s t w i r t . , D i e n s t l e i s t . ) T o t a l
% A b s K o m p e t e n z h o c h + K o m p e t e n z h o c h - K o m p e t e n z n i e d r i g - K o m p e t e n z n i e d r i g + P r o g B e r u f P r o g B r a n c h e K o n z B e r u f e K o n z B r a n c h e n